This post will be about a cool new feature engineering technique for encoding sets of vectors as a single vector - as described in the recent paper An efficient manifold density estimator for all recommendation systems. The paper focuses on EMDE’s applications to recommender systems but I’m more interested in the technique itself.
I will provide motivation for the technique, a python implementation of it and finally some benchmarks.
Aggregating vectors as feature engineering
From a pragmatic perspective, EMDE is just an algorithm for compressing sets of vectors into a single fixed-width vector.
Aggregating a set of vectors into a single vector may seem like a pretty esoteric requirement but it is actually quite common. It often arises when you have one kind of entities (users) interacting with another (items, merchants, websites).
Let’s say you already have a vector representation (embedding) of every food item in the world. Like any good embedding, it captures the metric relations between the underlying objects - similar foods are represented by similar vectors and vice versa. You also have a list of people and the foods they like. You would like to leverage the food embeddings to create embeddings of the people - for the purpose of recommendation or classification or any other person-based ML task.
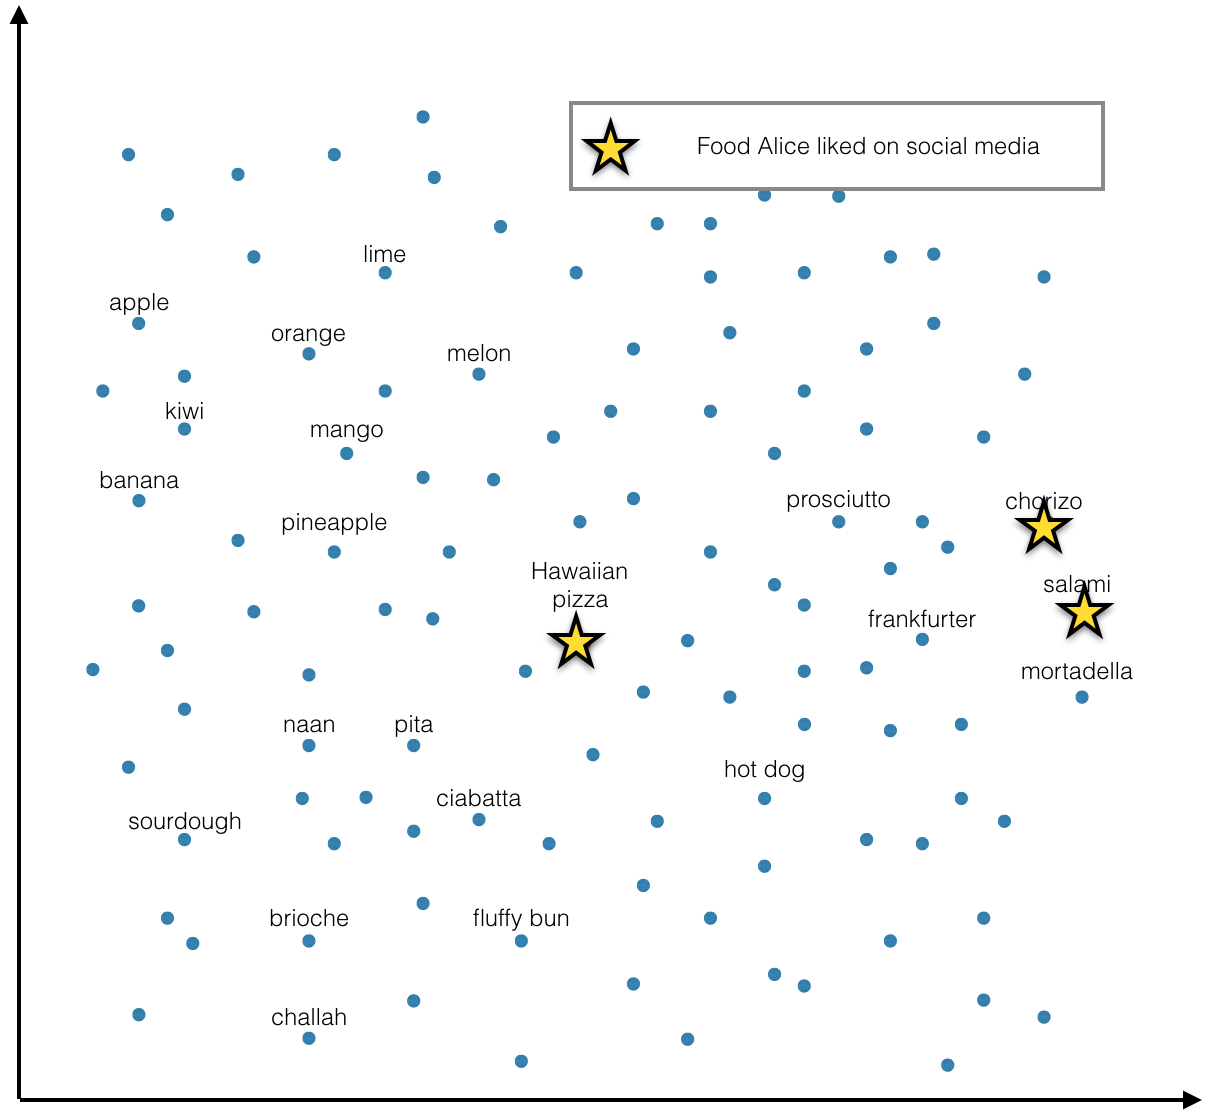
Somehow you want to turn the information that Alice likes salami, chorizo and Hawaiian pizza (mapped to vectors v1, v2, v3) into a single vector representing Alice. The procedure should work regardless of how many food items a person likes.
Aggregating vectors as density estimation
Another way of looking at the same problem - and one taken by the authors of the EMDE paper - is as a problem of estimation of a density function in the embedding space.
Instead of thinking of foods as distinct points in space, we can imagine a continuous shape - a manifold - in the embedding space whose every point corresponds to a food - real or potential. Some of the points on this manifold are familiar - an apple or a salami. But between the familiar ones there is a whole continuum of foods that could be. An apple-flavored salami? Apple and salami salad? If prosciutto e melone is a thing, why not salami apple?
In this model we can think of Alice’s preferences as a probability density function defined on the manifold. Maybe function’s value is highest in the cured meats region of the manifold, lower around pizzas and zero near the fruits. That means Alice likes salami, chorizo, pepperoni and every other similar sausage we can invent but she only likes some pizzas and none of the fruits.
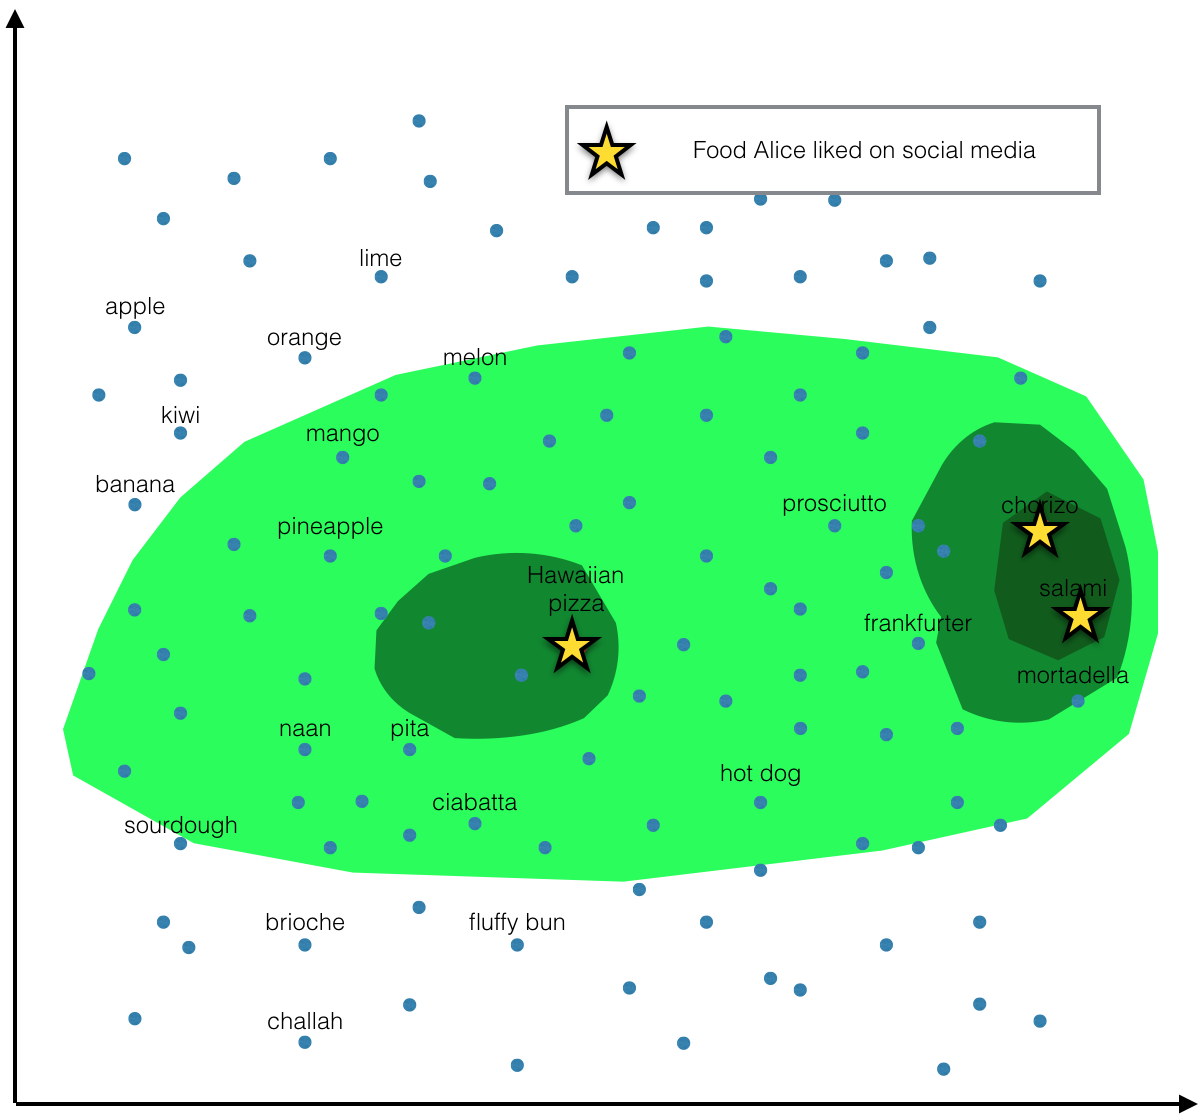
This density function is latent - we can’t measure it directly. All we know is the handful of foods that Alice explicitly liked. We can interpret these items as points drawn from the latent probability distribution. What we’re trying to do is use the sample to get an estimate of the pdf. The reason this estimation is at all possible is that we believe the function is well-behaved in the embedding space - it doesn’t vary too wildly between neighbouring items. If Alice likes salami and chorizo, she will also probably like other similar kinds of sausage like pepperoni.
Viewed from this perspective, the purpose of EMDE is to:
- Parametrize the space of all probability distributions over the manifold of food items.
- Estimate the paramaters of a specific distribution based on a sample.
The estimated parameters can then serve as a feature vector describing the user.
How not to do it
The most straightforward way of summarising a list of vectors is by taking their arithmetic average. That’s exactly what I have tried in my post from 2016. It worked okay-ish as a feature engineering technique but clearly a lot of detail gets lost this way. For instance, by looking at just the average vector, you can’t tell the difference between someone who likes hot dogs and someone else who only likes buns and frankfurters separately.
The average is just a summary statistic of a distribution - but what EMDE is trying to do is capture the full distribution itself (up to a finite but arbitrary precision).
EMDE - idea
The input to this algorithm consists of:
- the set of embeddings of all items
- list of items per user
And the hyperparameters:
- K - the number of hyperplanes in a single partitioning
- and N - the number of independent partitionings
The output is a sparse embedding of each user.
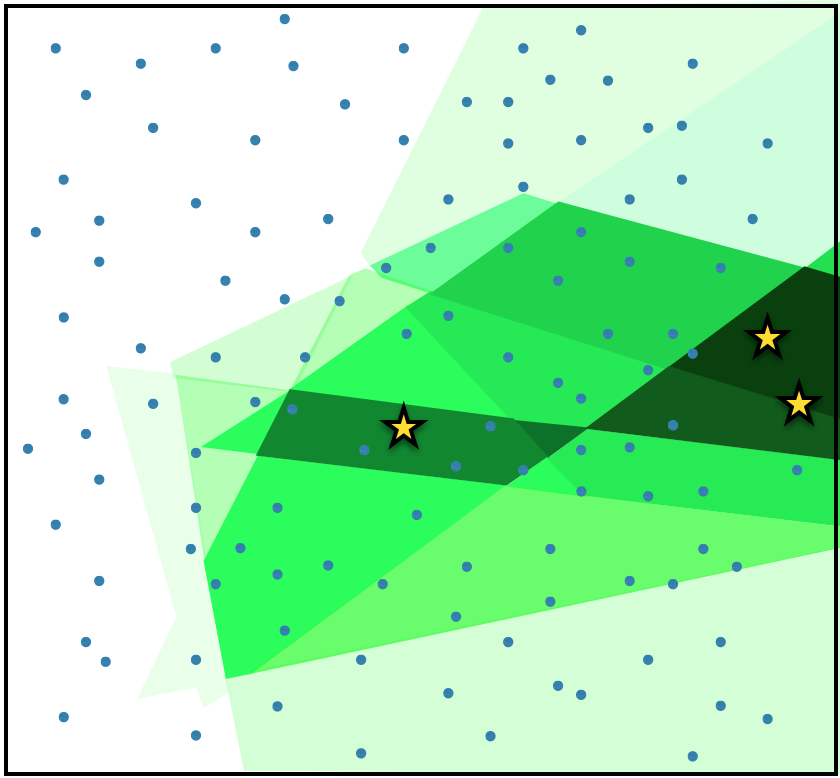
The algorithm (the illustrations will use K=3 and N=4):
1.
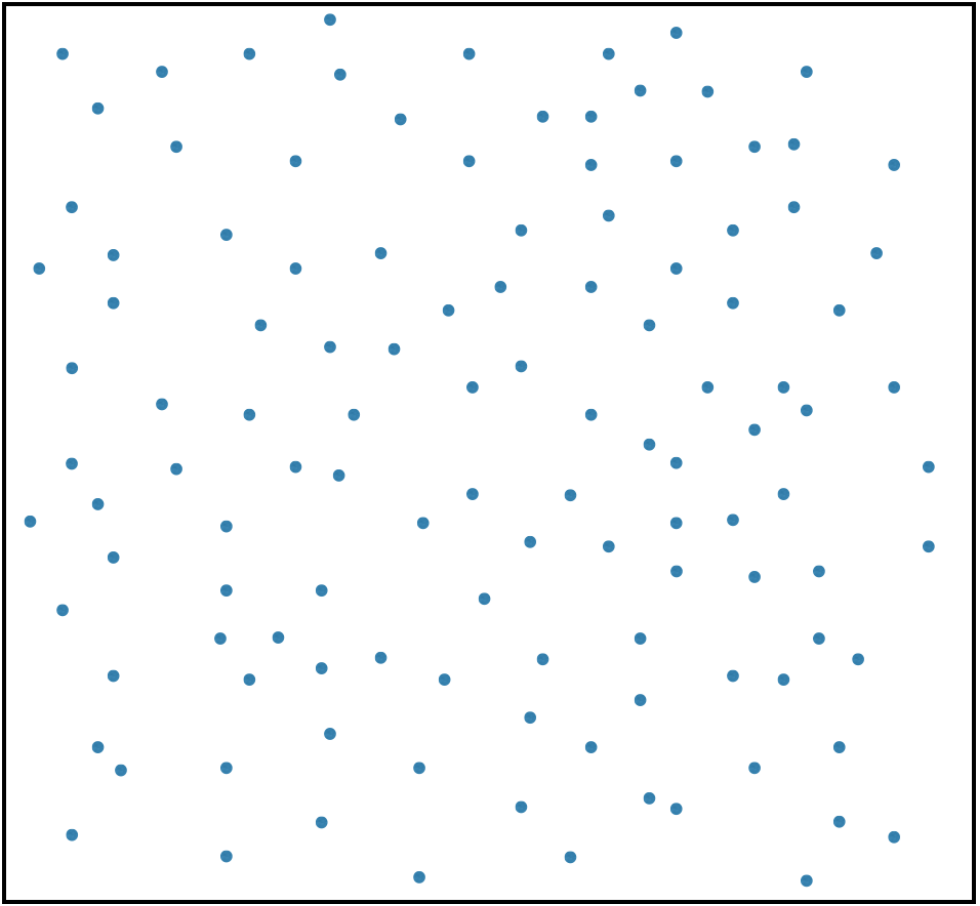
Start with the set of embeddings of all items.
2.
Cut the space into regions (buckets) using random hyperplanes. The orientation of the hyperplanes is uniformly random and their position is drawn from the distribution of the item vectors. That means the planes always cut through the data and most often through regions where data is dense, never outside the range of data.
Assign numbers to the regions.
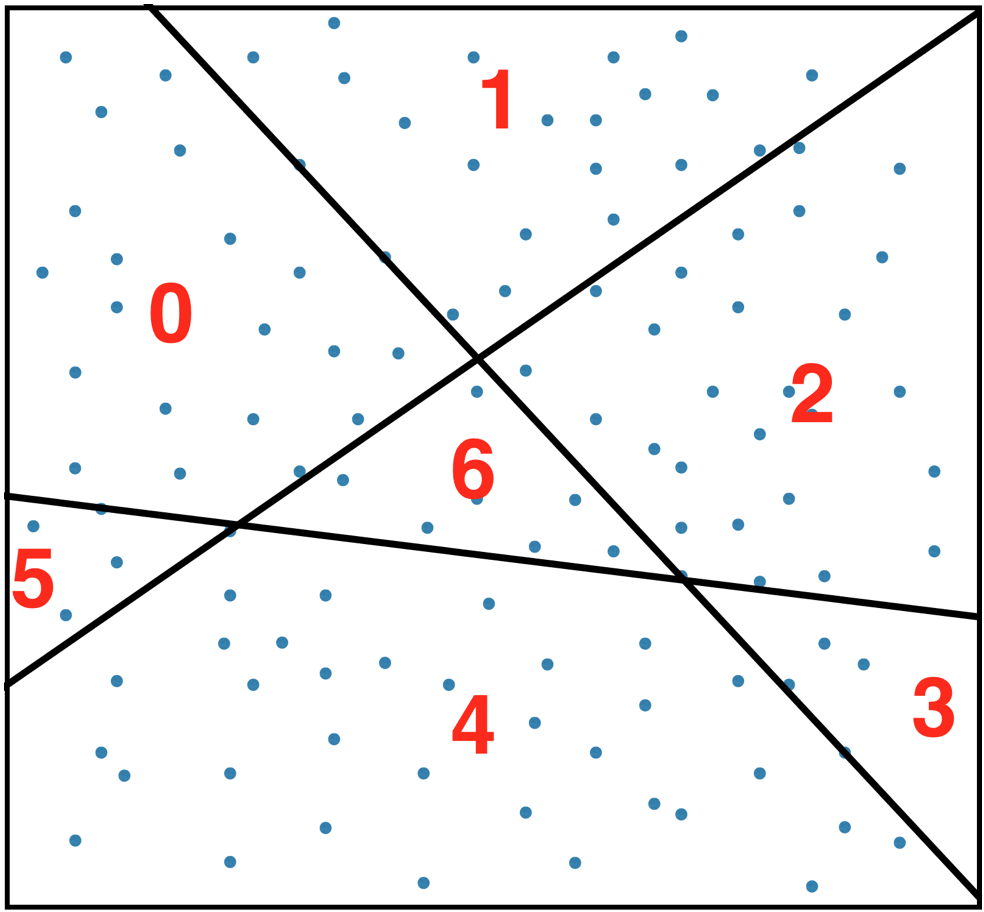
3.
For each user count items in each bucket.
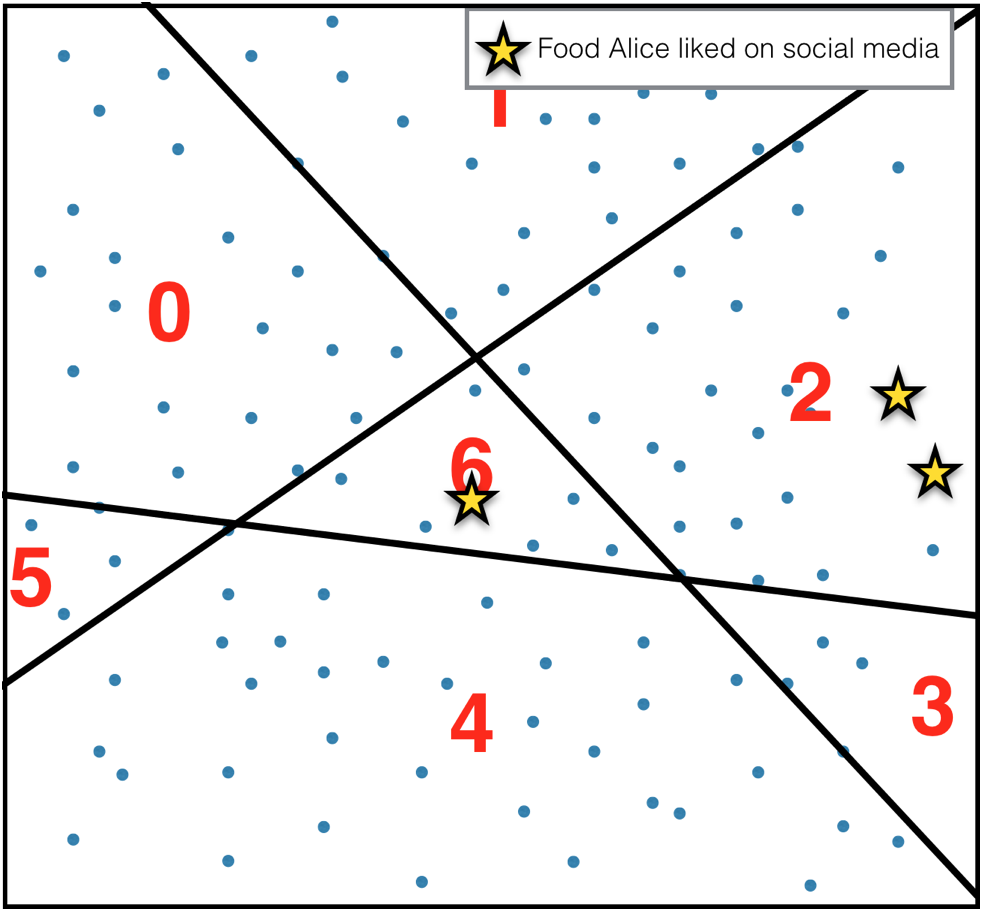
The sequence of numbers generated this way
1
| |
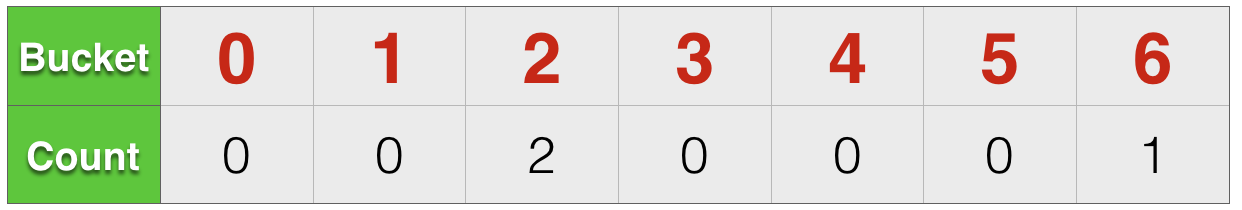
is the desired summary of the user’s items (almost). It is easy to see that these numbers define a coarse-grained density function over the space of items - like so:
4.
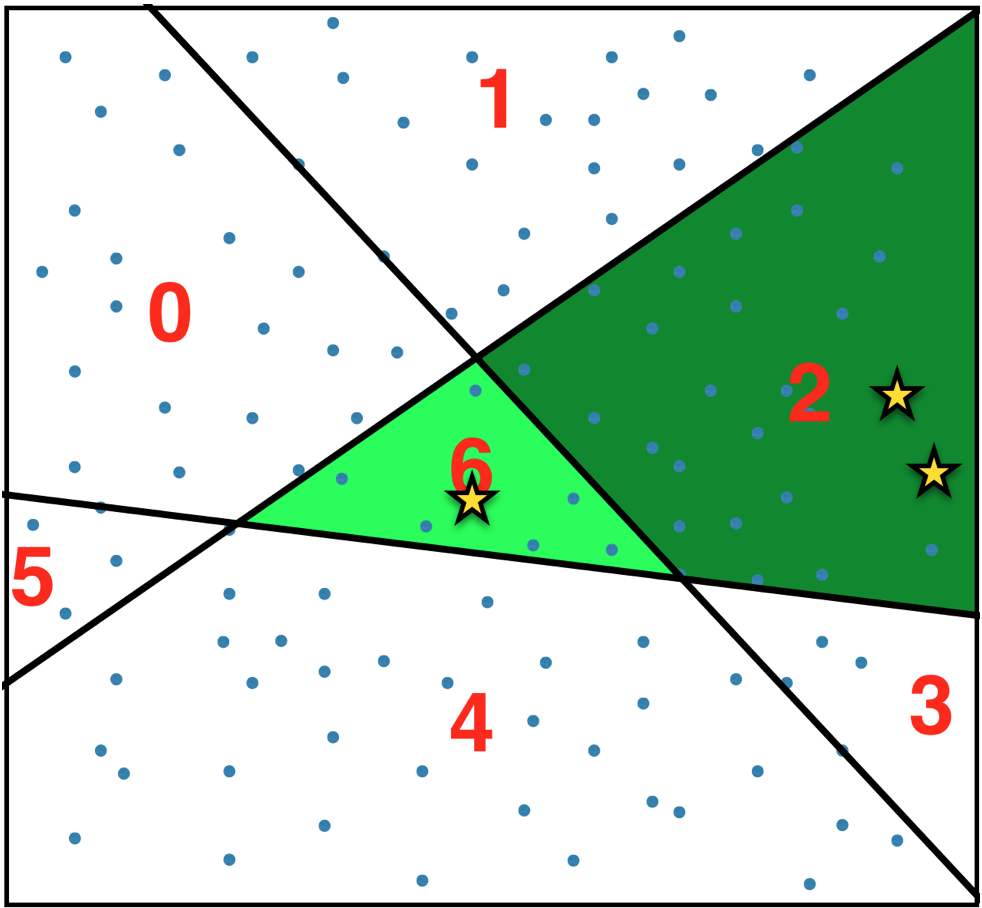
To get a more fine-grained estimate of the latent density, we need to repeat steps 2. and 3. N times and concatenate the resulting count vectors per user.
This sequence of numbers (the authors of the paper call it a “sketch” as it is a kind of a Count Sketch)
1
| |
is the final output of EMDE (for one particular user).
The corresponding density function would look something like this:
Two important properties of this algorithm:
- The resulting sketches are additive -
sketch({apple, salami}) = sketch({apple}) + sketch({salami}). - Similar items tend to fall into the same bucket so they end up with a similar sketch -
sketch({apple, salami}) ~ sketch({pear, chorizo}).
K and N
The authors of the EMDE paper suggest that sketch width = 128 (roughly corresponding to K=7) is a good default setting and one should spend one’s dimensionality budget on increasing N rather than K beyond this point.
But why bother with N sets of hyperplanes at all? Why not use all of them in one go (N=1, big K)?
The answer (I think) is that we don’t want the buckets to get too small. The entire point of EMDE is to have multiple similar items land in the same bucket - otherwise it’s just one-hot encoding. OHE is not a bad thing in itself but it’s not leveraging the embeddings anymore.
Having large buckets (small K), on the other hand leads to false positives - dissimilar items landing in the same bucket - but we mitigate this problem by having N overlapping sets of buckets. Even if bananas and chorizo end up in the same bucket one of the sets, they probably won’t in the others.
That being said, I have tried lots of different combinations of K and N and can’t see any clear pattern regarding what works best.
EMDE - implementation
Once trained on a set of vectors, EMDE can be used to transform any other sets of vectors - as long as they have the same dimension. However, in most applications, all the item vectors are static and known up front. The following implementation will assume that this is the case which will let us make the code cleaner and more efficient. I have included the more general, less efficient implementation here.
Thanks to additivity of sketches, to find the sketch of any given set of items it is enough to find the sketches of all the individual items and add them. Since all the items are know at training time, we can just pre-calculate sketches for all of them and simply add them at prediction time.
The following function pre-calculates sketches for all the items given their embeddings.
Linear algebra 101 reminder: a hyperplane is the set of points $\vec{x}$ in a Euclidean space that satisfy:
for some constant $\vec{v}$, $c$.
If $\vec{v} \cdot \vec{x} > c$ - then $\vec{x}$ lies to one side of the hyperplane. If $\vec{v} \cdot \vec{x} < c$ - it lies on the other side.
1 2 3 4 5 6 7 8 9 10 11 12 13 14 15 16 17 18 19 20 21 22 23 24 25 26 27 28 29 30 31 32 33 34 35 36 37 38 39 | |
Note that CountVectorizer above makes sure that only the buckets with at least one vector in them are represented. As a result, the width of a single sketch which is at most $2^K$ ($2^K N$ for the full sketch), in practice is often much lower - especially for low dimensional embeddings.
Now, for convenience, we can wrap this up in a sklearn-like interface while adding the option to use tfidf weighting for items.
1 2 3 4 5 6 7 8 9 10 11 12 13 14 15 16 17 18 19 20 | |
It can be used like this:
1 2 3 4 5 6 7 8 9 10 11 12 13 14 15 | |
The result is:
1 2 3 4 5 | |
Before passing this sketch to a ML model, you might want to normalize it row-wise. The paper suggests ‘L2’ normalization. I’ve had even better results with max norm:
1 2 3 | |
Benchmarks
To test the efficacy of the EMDE approach I used the good old text classification benchmarks - 20 Newsgroups and R8.
In both cases I trained Word2Vec on all the texts to get a word embedding and then used EMDE to generate a sketch for every document by aggregating the word embeddings. Then I trained and tested a logistic regression (with 5-fold cross validation) on the sketches as well as on the raw word counts and on averaged embeddings.
The results for R8:
1 2 3 4 5 6 7 8 9 10 11 | |
And for 20 Newsgroups:
1 2 3 4 5 6 7 8 9 10 11 | |
First of all - you’ll notice that all the EMDE dimensionalities tend to be lower for the R8 dataset than for 20 Newsgroups. That is because R8 is a much smaller dataset with fewer distinct words in it (23k vs 93k). Consequently you more often end up with an empty bucket - and those get dropped by CountVectorizer.
As for the actual results:
- overall (some) EMDE sketches beat one-hot-encoding on both benchmarks and by a fairly wide margin
- averaging embedding vectors doesn’t perform well at all
- the higher dimensional sketches tend to do better on these datasets
- there is no clear pattern regarding the importance of increasing K vs N.
K=30 N=1is on top of one of the benchmarks.K=30 N=2000wins in the other
In conclusion - EMDE is simple, fast, efficient. It will make a great addition to the feature engineering arsenal of any data scientist.