Interviews
I like to think of myself as a supervised learning algorithm. Give me 500 questions and 500 correct answers and I’ll take it from there. Unfortunately training examples for data science interviews are relatively scarce especially compared to software developer equivalents. There is the book “Data Science Interviews Exposed” which has a bunch but not nearly enough and there is “120 Data Science Interview Questions” which doesn’t have any answers. Having suffered through a lot of those interviews lately, I can now make a contribution to this pool. These are the questions I was asked in data scientist/machine learning engineer/data science consultant interviews (the ones that I remember and am allowed to disclose). The interviews took place mostly in London and mostly during 2014-2015. I list all the questions I got ordered by type from least to most interesting. I included my answers for the good ones at the bottom. I also editorialize a bit here and there and give advice on how to prepare but take with a grain of salt - my experience isn’t extensive enough that I can say anything with high confidence. But who can, really - it’s all so new, no one knows what they’re doing, everyone is just winging it (<- see, editorializing right here).
Technology trivia
This is the lowest common denominator of tech interviews. Questions in this category are intended to test whether you are actually familiar with all the tech you put in your resume. They are quick, easy and superficial. If you are actually using technology X with any kind of regularity, you should have no problem answering them. Otherwise if you feel rusty, just spend a few hours with google and wikipedia and you’re good to go. Most screening interviews I’ve had featured several of these questions and they popped up every single time I was interviewed by an engineer.
- are you familiar with git/linux/bash/excel (they asked me this because I didn’t put it on my resume)
- what is “yield” in python (asked on at least 3 occasions)
- tell me about functional programming in python
- what are “lambdas” in python
- which python libraries are you using (they wanted to hear scikit-learn, numpy, pandas)
- what is the syntax for multiplying numpy matrices?
- what is the difference between final, finally and finalize in java?
- tell me about catching exceptions in java
- what do you know about garbage collection in java?
- tell me about threads in java
- what is the difference between hadoop and spark which do you like better?
- tell me about broadcasting in spark
- which hadoop distribution are you (have you been) using - Cloudera or Hortonworks? Incredibly relevant, I know. This is what happens when you send an engineer to interview data scientists.
- what is combiner in map-reduce?
- what do you know about Elasticsearch?
- have you ever used mysql/postresql/plsql/tsql?
Programming problems
Straight up coding questions - the likes of which you would find in a typical software engineering interview. If the following problems seem anything less than trivial to you, there are tons of resources out there to prepare for coding interviews. I recommend “Cracking the coding interview” and the online judge at leetcode.com, just the problems labeled “easy” should be enough.
write regular expression to match legal IP addresses
write any n log(n) sorting algorithm
implement a tail-recursive factorial function
find minimum of a rotated sorted array
write a function that tests whether two strings are anagrams
find duplicate lines in file. Do it in bash, in python, in mapreduce (your mapper function is fed lines of the file), in sql (the file is represented as a table with only one column “line”)
an array contains n distinct numbers taken from 0, 1, 2, …, n, find the one that is missing from the array
“content_actions” is a table that logs user activity.
 user_id   content_id     date     content_type   target_id
   22         1234     2015-02-01     photo         null
   13         3456     2015-02-01    comment        1234
   47         5678     2015-02-02    comment        1234
it has the following columns:
- user_id: a unique id for the user taking the action
- content_id: a unique id for the content being generated
- date
- content_type: a string that is one of the following {‘post’, ‘share’, ‘photo’, ‘comment’}
- target_id: The id of the object that is receiving this content. In the case of a comment, this is the id of the content that is being commented on.
Write a SQL query to compute the distribution of the number comments per story. Output should look like:
  n_comments   n_occurence
      1         5,000,000
      2         3,000,000
Followup: do the same for each story type. Output should look like:
  story_type   n_comments   n_occurence
     share         0         3,000,000
     photo         1         2,000,000
     share         1         1,000,000
     photo         2         1,500,000
Followup 2: this query is taking a lot of time to run. Is there a way to maybe get an approximate answer but get it much faster?
Many companies actually didn’t ask me a single coding question at any stage which is somewhat astonishing considering that it’s a job where coding is your main tool and code your main output.
Probability and statistics
Probability and stats are supposed to be a big part of data science but you wouldn’t guess it from my interview questions. Most companies didn’t ask about it at all. But that was not unexpected since most of my interviewers were CS educated and probably not that hot on statistics themselves. Nevertheless, probability is still ostensibly an important foundation of data science and it’s inevitably going to get more love once there are more competent people around and running the interviews, so you may still want to invest some time in it. As with everything else, interview questions about probability can be tricky but cannot be very deep. So rather than picking up a thick textbook and abandoning it at chapter 3 out of boredom, you will be better off just practicing probability interview questions. I’m assuming here that you do know the highschool-level basics - otherwise go learn that instead. Where do you find probability interview-type questions in bulk? Quant books. “Heard on The Street”, “Frequently Asked Questions in Quantitative Finance”, “Quant Job Interview Questions and Answers” - if you solve these (it’s just one chapter in each) you’ll be ready for anything data scientists will throw at you.
- there are 50 blue marbles and 50 red ones and two jars. You are to place all marbles in the jars and then choose one of the jars at random and pick a marble from it at random. How many red and how many blue marbles should you place in each jar to maximise the probability of picking a blue marble?
- what is the probability of picking 2 cards of the same color in a hand of 4 cards (and a bunch of other similar car questions)
- tell me about bayesian probability (only asked because I bragged about doing something bayesian or other)
- this python code below calculates the maximum of an array. Calculate the expected number of times the expression
max_num = iwill be evaluated.
def find_max(x):
    max_num = x[0]
    for i in x[1:]:
        if i > max_num:
            max_num = i  #Expected number of times this is evaluated
    return max_num
There was only one company (in finance) where it was a quant running the interviews, so there was much more stats:
- given these plots (hands me a bunch of plots) recognise: autocorrelation, cyclicality, heteroskedasticity, partial autocorrelation, outliers, correlation
Machine learning
Machine learning is the workhorse of data science but you don’t have to be intimately acquainted with it to have it do your bidding. On the job surprisingly little rides on you knowing how your favorite ml library works inside. Plus Lasso* is the fanciest algorithm most of my interviewers hoof heard of (I’m on a roll!). As a result most ML questions are simple and knowledge-based (i.e. ML-flavored trivia).
- tell me about linear regression - the only ML algorithm that I was ever asked to derive - and on 3 separate occasions
- tell me about logistic regression
- tell me about regularization, what’s it for?
- what is the difference between ridge regression and lasso?
Questions about regularization usually follow questions about regression. Interviewers variously refer to regularization schemes as “L2 regularization”, “L1 regularization”, “ridge regression” or “Lasso”. Familiarising yourself with the terminology is a cost effective way to make a good impression.
- what are svm? what are they good for? when would you use an svm and when logistic regression?
- explain random forests to me
- what is bias-variance tradeoff?
- what is overfitting, how do you deal with it?
- what is in-sample and out-of sample error?
- what are supervised and unsupervised learning?
- implement k-nearest neighbours, followup: what is the complexity of your implementation? How would you improve it to make it run on huge datasets?
- open this file with emails labeled as ham or spam and implement and train a spam detector algorithm from scratch (no machine learning libraries allowed)
I implemented multinomial naive bayes and it worked like a charm (on a subset of labeled emails that I saved for cross-validation). The last two questions were from the same company, interviewing for the position of machine learning engineer. I don’t know of any other companies that ask candidates to actually implement ML algorithms in an interview but if you find one, I have prepared a bunch of bare-bones implementations of basic ML algorithms (the ones that are actually doable in half an hour). They are obviously very crude, but more importantly they’re short and simple so you can easily replicate them in an interview.
Other than this one company, all I was ever asked about ML can be found in any introductory ML course. I liked Andrew Ng’s one on Coursera.
* not really, but couldn’t resist, sorry
Open problems (aka actual data science)
There comes a point in the recruitment process when your interviewers run out of python trivia and have to ask one or more actually job-related questions. These aren’t as easily googlable so I provide solutions. The questions are open-ended and my solutions are neither unique nor the best possible - they are just something I came up with at the time and they were good enough to get me to the next stage. Obviously I cleaned them up, corrected and clarified them a bit for the writeup, I’m not this eloquent in person. If you find something worng with my answers please let me know in the comments.
You’ll notice that many of the solutions follow a very simple pattern: “this can be viewed as a supervised classification problem therefore I will use Logistic Regression (or Naive Bayes or whatever)”. It sounds a bit trivial but this is what the interviewer wants to hear. She wants to make sure that faced with a machine learning type problem you will go for a machine learning solution (and not for example try to classify stuff by hand or heuristics), and the right machine learning solution at that.
Analytics conundrum
After we changed the color of the button in our mobile app, the metrics changed like this:
| Metric | Change |
|---|---|
| comments | +5% |
| likes | -10% |
| time spent | +1% |
| everything else | +1% |
Is this good or bad overall? How would you find out for sure? (asked in an interview with an ad-driven business)
First thing to note is that likes, comments etc. are not valuable to us in and of themselves. Advertiser’s money is what we ultimately care about. But since it’s illegal to try to get the money from advertiser’s accounts directly, we attempt to make a good product instead, on the logic that:
good product -> engaged users -> returning users, more users -> more clicks -> more ad revenue
Likes, comments etc. only serve as measures of user engagement which itself is only important insofar as it leads to revenue. With that in mind - how did the button change affect engagement? My hunch is that average engagement after the change is higher. Likes are cheap - it takes a fraction of a second to “like” something and much longer to comment, so commenting is a much stronger indicator of engagement then liking. The fact that the total time spent went up only confirms it. That being said, it’s impossible to tell for sure from the data that we have been given. We don’t know the base rates for instance. Perhaps the comments were extremely uncommon in the first place and went from 20/day to 21/day while likes dropped from 100000/day to 90000/day - this doesn’t look so good anymore. How to find out for sure? We have to somehow gauge the impact of the change on things in the chain of proxies down from the metrics. Ideally run an AB test and observe over the long run how each button color affects ad revenue per user. But it is not feasible to do this kind of long term AB testing with every button color change - if it was we wouldn’t need all the comments and likes metrics in the first place. Easier but less accurate would be to survey both groups to find out about their engagement directly (but this has its own problems). Another idea - and the main point of this answer is this: by looking at historic data, we can find out how much each marginal like and marginal comment and marginal minute spent are worth relative to each other. How? Just run a linear regression with independent variables (X-es) being the historic values of your metrics and the dependent variable (y) being ad revenue per user per month. The result would look something like this:
$$ ad_revenue = a + b \cdot clicks + c \cdot comments + d \cdot time_spent $$
The coefficients $b$, $c$, $d$ tell you exactly how much an additional click, comment or minute spent are worth, respectively. You can just plug the pre- and post-change numbers into the formula to see the impact on expected revenue.
Recommending sports bets
You work for an online gambling company. The company offers its users bets on thousands of current sports events. One of the most important aspects of this business is recommending to users sports events that they are likely to bet on. The company is already using all kinds of historical user data to do this. What external datasets would you use to improve the recommendations and how?
Social media. Track what sports events people are liking, sharing, tweeting about. It’s a good bet that the events most popular on social media will also be popular among gamblers. Plug the volume of e.g. tweets mentioning the event as a feature into your event-scoring algorithm. Sentiment of the tweets may also be relevant - but exactly how requires investigation. Same approach may be applied to news articles - if you have access to a news API.
Locating homes
Banana Computers, manufacturer of mobile devices wants to know where each user of its devices lives. Every app on Banana’s phones and tablets periodically (on startup and every 5 mins) sends a heartbeat to Banana’s HQ. Each heartbeat contains (timestamp, precise geographical coordinates, id of the active app). Id of the app is persistent on a given device but randomized across different devices. What that means is that you can tell whether two heartbeats from the same device came from the same app but you don’t know what app is that. How would you use this data to find out where the owner of each device lives (as in geographical coordinates or address). Followup: How would you sanity check your algorithm?
The general approach is this:
- Look for spatially tight clusters of heartbeats - they correspond to locations where the user spends a lot of time. This will be an unsupervised algorithm.
- For each cluster use a classifier to decide whether this is the person’s home or some other location like worplace or school. This step will employ a supervised algorithm if we can get our hands on a training set of users we know the addresses of. Otherwise we will have to manually craft some heuristics.
For the first step we can use some kind of density based clustering algorithm (this is one of the cases where k-means would not work). For example, you can put a gaussian kernel at each heartbeat’s location and look for areas where the resulting density exceeds some threshold - those areas should be small islands on the map located where the user spends most time*. Or - which amounts to the same thing - look for areas on the map that have at least n heartbeats within x meters. From each chosen area select one point that will represent it - the center of mass will do fine. As for the second part - this is a binary classification problem (is home - is not home) and there are many ml algorithms to choose from. Undoubtedly though the strength of our predictions will depend more on what features we create than on the type of classifier used so let’s tentatively go with the simplest one - logistic regression - and concentrate on feature engineering. What kinds of things are likely to be good at distingushing homes from other locations where users spend their time?
- fraction of all heartbeats that fall in that location. Typical user should be expected to spend more time at home than any other location, though that is far from conclusive
- timing. You expect the heartbeats from home to fall outside work and school hours, especially early in the morning. Some people work night shifts but few work 7 days a week and on all holidays. So if a location has heartbeats every day of the week or on holidays, this is strong evidence that it’s a home. We can also get more sophisticated and try to look for sleep patterns - someone opening an app then about 8 hours of silence, then opening an app again. All these things can be turned into features in at least two ways - a binary feature that says that a pattern occured or not, or a numerical feature that says with what frequency (times / month) does the pattern occur.
- a sanity check for the algorithm and also a good feature in itself is this - is this location in a residential district or in an office building/school/factory/shopping district. An algorithm using only the timing-related features should already be quite decent - so if you see that it locates homes in the wrong types of neighbourhoods - there must be something wrong with the implementation
*this is unnecessarily complicated but I came up with it on the spot and it was good enough for my interviewer
Predicting page jumps
A web app consists of hundreds of pages. A user spends some time on a page, clicks a link that transports them to a different page, spends some time on this one, clicks on another link and so on. This is what we call a user journey. We collect data about all user journeys - the identity of the user, the sequence of pages visited in a single session and timestamp of every page jump. Your job is to devise an algorithm that will predict in real time, which page will a user visit next so we can preload it and save money on cdn*. What features would you construct? What algorithm would you use? How do you reduce dimensionality of your feature space? If you don’t want to train your algorithm on full historical dataset, how would you pick training examples? *not absolutely necessary but probably worth knowing what a cdn is
First note that this is a supervised classification problem. Given a user’s journey so far we will try to predict which of $k$ possible pages will they visit next - hence it’s an $k+1$ -way classification. The $+1$ comes from the fact that the user may end their journey at the current page - we will represent this as a separate label. It’s supervised because we are given a training set of previous journeys. Actually we are just given the journeys and we have to construct the training set, but that’s relatively straightforward. For a journey consisting of pages A -> B -> C -> D, we can construct 4 training examples by cutting it at different points. For example we can stop the journey at C and ask what will the next page be. The features will be extracted from eveyrthing that happened on the path A -> B -> C and the label will be D. On to feature engineering:
where you will go strongly depends on where you are - so the single most important feature will be the identity of the current page - a categorical feature with $n$ values
where you came from is relevant as well - so bi-grams, tri-grams and perhaps even longer n-grams will make for good features. By an n-gram I mean the sequence of $n$ most recently visited pages like this tri-gram: A -> B -> C. There is a clear analogy with NLP here - pages are like words and journeys correspond to sentences - hence the use of the term “n-gram”.
there may also be some long distance influences that are not captured by n-grams. For example the first page visited during a journey or whether or not some particular page was visited at any point during this journey. If there is a login page then whether it was visited or not has impacts all of the subsequent journey no matter how distant.
timing - the amount of time spent in the current page, previous pages, whether or not the latest jump was very quick (suggesting a misclick)
user-level features. For almost all of the above features it makes sense to have a separate version of the feature for every user. For example in addition to the feature “last two pages” with the value “A -> B” you can have a feature “last two pages + the identity of the user” with the value “A -> B; John Smith”. This way the algorithm will learn patterns that apply roughly to a typical user’s journey but it will be capable of overriding it with information specific to a particular user once it collects enough examples for the individual. If users fall into any kinds of natural groups - like users from the same country or from the same company (maybe it’s an enterprise app) - you can apply the same approach substituting “group id” for “user id”. Which classifier do we use? Naive bayes should do the job. N-grams and user - specific features mean we will be dealing with huge dimensionality of the input space. Naive bayes is one of the few classifiers that can deal with it in reasonable time. Besides, it’s good at n-ary classfication and probabilistic problems with a soft decision boundary. How to deal with the dimensionality?
first of all - for naive bayes we don’t have to represent a categorical feature with $k$ possible values as a vector of $k$ binary coordinates as is the case for most other classfiers. So the dimensionality doesn’t bother us that much.
we can simply drop all features that have too few instances in the training set. For example for every bi-gram that occured less than 5 times in the training set, we can replace it with the word “other”. This is not done to avoid overfitting - we have regularization for that - but to save space on model coefficients. The way our features are constructed (n-grams + per-user features) there is likely to be a huge number of features that occured only once in the training set, maybe so big that it wouldn’t fit in RAM. Dropping infrequent features should take care of that.
if we want to really get the dimension down to hundreds so that we can use other more sophisticated algorithms, just dropping infrequent features isn’t gonna cut it. We could try to use some generic dimensionality reduction technique like PCA but I doubt the results would be good in this case. The analogy with natural language suggests a better solution. If pages are words and journeys are sentences then we can run topic modeling on the set of journeys. A topic modeling algorithm is trained on a collection of texts and it learns to represent texts as mixtures of a small number of topics. The coefficients of that mixture can be seen as coordinates in a vector space. The dimension of that space is equal to the number of topics (which we can specify when training the topic model). Thus we go from an arbitrarily long sequences of words from a (possibly very large) vocabulary to numerical vectors in (for example) 100 dimensions.
How to choose examples for the trainging set?
Let us note first that there is no good reason not to train the algorithm on full historical data. Training of naive bayes consists of just counting frequencies of labels for every feature and can be done online (which means one example at a time). So every time new data comes in, we can update the counts, there is no need to touch previously processed data. That being said, if for whatever reason we needed to pick only a subset of historical data for training, we should make sure that every feature is represented enough times in the training set so the counts are accurate. How many is “enough” depends on the number of different labels. I estimate that for $k$ labels $(k-1) \cdot 100$ examples per feature is more than enough. Having more is not going to make any difference to the model’s fitness. In practice we won’t be able to achieve the required numbers for every feature because there are just too many of them. We will have to settle for having enough occurences of the most common features and hope that regularization will smooth out any inaccuracies that will arise from not having enough occurences of remaining features.
Efficient odds
This one actually happened to my wife. We have data on sports bets - the odds, the stake, the outcome and the identity of the bettor for a number of bets. A record for a single bet may look something like this:
odds:       3 to 1  #(which implies probability 0.25)
stake:      $10
outcome:    False (bettor lost the bet)
bettor_id:  1234
Your task is to figure out if any of the bettors are using inside knowledge to achieve success rates greater than would happen just by chance. If someone was only making bets when the odds are 0.1 (9 to 1) and consistently, in the long run winning 0.2 of them - this would be an example of such a situation. Make sure that your solution is algorithmically efficient enough that it can quickly run on a dataset of tens of millions of bets. You can neglect bookie’s profit margin and treat all bets as fair.
The idea is simple. Since the expected value of any bet is 0, if a gambler accumulates significant winnings after a long series of bets - then probably something shady is going on. We will give precise mathematical meaning to this in a moment, but first let’s explain what do we mean “something shady”. You can think about it in two ways:
- There is a ’true probability’ $p$ of some horse winning a race but the bookie only knows it approximately. He thinks the probability is $p_1 < p$ and offers odds accordingly. The gambler is better informed than the bookie (and this is the shady part) so he takes the bet because he knows it has positive expected value. If $p_1 > p$ he would bet the opposite way and also achieve positive expected return.
- The bookie knows the ’true probability’ $p$ and offers fair odds but we treat the gambler’s choice of bet (for or against) as a random event. In this view “something shady” means that the two random events - race result and gambler picking a bet - are not independent. If they were, the expected return for the gambler would be 0. But if the gambler’s picking the bet “for” was positively correlated with the horse’s winning the race - he would win more than lose on average.
The two views are equivalent, which becomes clearer if you accept the bayesian view of probability but this is not the place for such philosophical discussions (and neither is a job interview). Enough chitchat, let’s do some math. Under null hypothesis (which is the same in both views) if the horse wins with probability $p$, the bookie will offer odds $\frac{1-p}{p}:1$ for and $\frac{p}{1-p}:1$ against. This means that if you bet on the horse winning you will get $\frac{1-p}{p}$ dollars for every dollar you bet (plus your dollar back). If you lose, you lose one dollar. So the expected value of the bet is:
$$ E(bet) = p \cdot \frac{1-p}{p} \cdot s + (1-p)(-1) \cdot s= 0 $$
Where $s$ denotes the stake. The variance is:
$$ var(bet) = p \cdot (\frac{1-p}{p} \cdot s)^2 $$
Winnings from a single bet are a binomial random variable with expected value 0 and variance given above. Total winnings after a series of bets have an expected value 0 and variance given by the sum of variances of each bet. If the series is long enough, the distribution of the sum can be approximated by a normal distribution. All that is left is to compare the gambler’s actual winnings against the normal distribution with 0 mean and known variance to get the p-value of it happening by chance. Last things to note:
- unless you believe that the gambler may be only using his superpowers when betting high stakes, you should normalise all his bets to one dollar - your test will have greater statistical power this way
- beware of multiple testing. If you run the test on thousands of gamblers, you’re bound to get some very low p-values just by chance. Use something like the Bonferroni correction if you want to avoid false positives
Rogue traders
A bank employs stock traders. Some of them go rogue i.e. start to perform fraudulent or unauthorised trades. You’re helping the bank discover those traders before they can do much damage. You have all the relevant financial information and also mountains of unstructured data about every trader: all of his/her emails and chats; recordings of all phone calls; times when entering/leaving the office; bathroom breaks etc.. (it is slightly amazing that banks collect all this data on their employees) How would you use all this data to detect rogue traders? In particular, how would you deal with the unstructured data sources? Follow-up: what is your general approach to utilising new types of data?
With a question like this the main thing is not to panic. Unless you’re applying as an expert in financial fraud, you’re not expected to know any techniques specific to banks and traders, just general data science approaches. The question doesn’t mention any technical details either, so we can be confident that the interviewer expects a high-level nontechnical answer.
In an ideal world we would have at our disposal historical data about all the bank’s traders, rogue or otherwise. In this scenario, the problem becomes a case of supervised classification. We use historical data to train a binary classifier tha can distinguish between rogue and honest traders. We then apply this classifier to the bank’s current employees and notify whomever is in charge if any of the results come out positive. In a more realistic scenario, there are too few historical examples of this kind of fraud to train a classifier. We will have to use anomaly detection instead. An anomaly detection model is trained on unlabeled data and it learns what a typical record looks like. Then it can be used to detect anything that doesn’t conform to the typical pattern. In our case it means learning how traders usually behave and flagging the ones that behave unusually. If there are any confirmed cases of fraud in the historical data, they can still be used to inform feature selection and to validate the model. Both binary classification and anomaly detection require models typically require that we feed them numerical vectors - letting them loose on a pile of stock charts in .jpeg and audio recordings in .mp3 is not going to work. Engineering appropriate features for the model will be the most important and hardest step of the solution.
- one type of features will be directly related to the kinds of trades the trader is making. I would need to consult an expert to say anything about those
- another promising set of features can be extracted from the logs of office activity. For example if a trader regularly works late so that he’s the only person in the office it is somewhat suspicious. If he comes in after everyone else has left - it’s doubly so. These patterns can be easily turned into a binary (occured - not occured) or numerical (occured x times a month) feature
- phonecalls and emails are sources of features in two ways. Via their metadata - with who, when, how often, how long - and via their content. Phonecalls have to be run through speech recognition software to be turned into words and emails need to be tokenized. Once they are converted into sequences of words, emails and recordings can be processed the same way. N-grams are features one typically uses to study the content of speech. At this point in the interview I was asked a followup question: What happens to the n-gram approach if rogue traders try to cheat the system by speaking in code?
If only fraudsters just kept using words like “fraud” and “scam” and greeting each other with a “yarr, matey”! If they aren’t so accomodating and pretend to talk about baseball instead, I can see only two ways out. Either train the classifier on fresh data every day so that it catches up with the changing cipher or get more robust features that don’t rely on the identities of words. The first approach could perhaps work in some internet community with lots of training data and real time feedback, in a bank it’s utterly impractical. The second method involves e.g. looking for phrases that occur frequently in conversations despite not being common in general speech or analysing the emotions of the text or level of familiarity between speakers (do they use curse words, informal language, do they laugh?).
How to utilise new types of data? Again, this is so broad it verges on meaninglessness. For any type of data there usually exist time-tested methods for extracting features from it. For time series there are Fourier coefficients, for text - n-grams, for images - convolutional neural networks. In many cases you can even find pretrained models to make your job easier. Once you have extracted a bunch of features appropriate for the given data type, you have to throw them at your problem and see what sticks. This is the part where human judgement comes in, there is no way around it.
Predicting clicks
We are a retargeting advertising agency - a company whose clients are various e-commerce businesses. Consider a typical client - online grocer Z. Z keeps track of the activity of each visitor at its website - what they click on, what they put in the basket, what they buy and when. It also injects a cookie in the visitor’s browser so that they will be recognized the next time they visit the website or anywhere else on the internet. Z hands all this information over to us and pays us for every user that returns to their website by clicking an ad we display (we are only concerned with returning users - hence REtargeting). The job of a data scientist here consists of predicting how likely a given user would be to click on an ad if we showed it to him. For instance if we knew that this person will click 0.005 of the time and that X pays us $0.1£$ for each click, then we would pay no more than $0.1£ \cdot 0.005 = 0.0005£$ for the right to display the ad. How would you approach calculating this probability given all the above mentioned information about the user as well as data on all past ad impressions (who was the person, how much did we pay to display the ad, did they click or not).
This is a classic example of supervised learning - classification. For every historical ad impression, we prepare a vector $X$ consisting of all the features of the user (and the ad) and the label $y$ which will be 1 if the user clicked on the ad and 0 otherwise. Then we train a binary classifier on all the $X$-s and $y$-s. We need to make sure that it’s the kind of classfier that outputs probabilities, logistic regression is the simplest example. Trained classfier can then be applied every time we encounter a familiar user to predict their probability of clicking on our ad. That’s it. Sensible features for the algorithm include:
- the identity of the host where the ad would be displayed (click through rates may differ from host to host). This translates to a set of binary features - as many as there are known hosts
- time of day. This can be implemented as a set 24 binary features (23 are enough actually) corresponding to hours of the day
- day of the week - same as above
- whether or not the user has left an unfinished basket at the website
- total value of the goods in the basket
- number of previous visits, purchases, viewed items, etc.
That’s it. Having worked at this company I could now give much more comprehensive answer but it was not necessary in the interview. This question was just supposed to test familiarity with the basics of applied machine learning, nothing more.
Ranking students
Your dataset consists of a few years’ worth of student grades from an american high school. How would you go about ranking students from best to worst given no other information? Keep in mind that each student may attend a different set of classes, classes may differ in difficulty and so on. Followup: how does your algorithm deal with non-overlapping curricula?
These data science case study questions are usually quite open-ended but this one is doubly so. Not only there may be many ways leading to your goal, even the definition of the goal itself is somewhat up to you. The answer I blurted out is emphatically not the only one and is unlikely to be the best one (whatever that means). Bayesian nets were just the first thing that came to my mind when I heard the problem. If they are not the first thing that occurs to you, or even if you’re not familiar with them at all, it’s alright, that was not to point of the question.
We will model a student as being characterized by a single parameter $x$. We don’t have to define $x$ other than to say that students with higher $x$ tend to take tougher courses, take more courses and get a better grade from any course they take. You can think of $x$ as intelligence, ambition and work ethic combined. It makes sense then to rank students according to their $x$ - if only we knew it. We don’t observe $x$ or difficulty $d$ directly but we do observe course enrolment $e$ and grade received $g$. We can model the interaction between $x$, $d$, $e$ and $g$ as a bayesian network. The network will have one $x$ node per student, one $d$ node per course and one of each $e$, $g$ for each pair student-course.
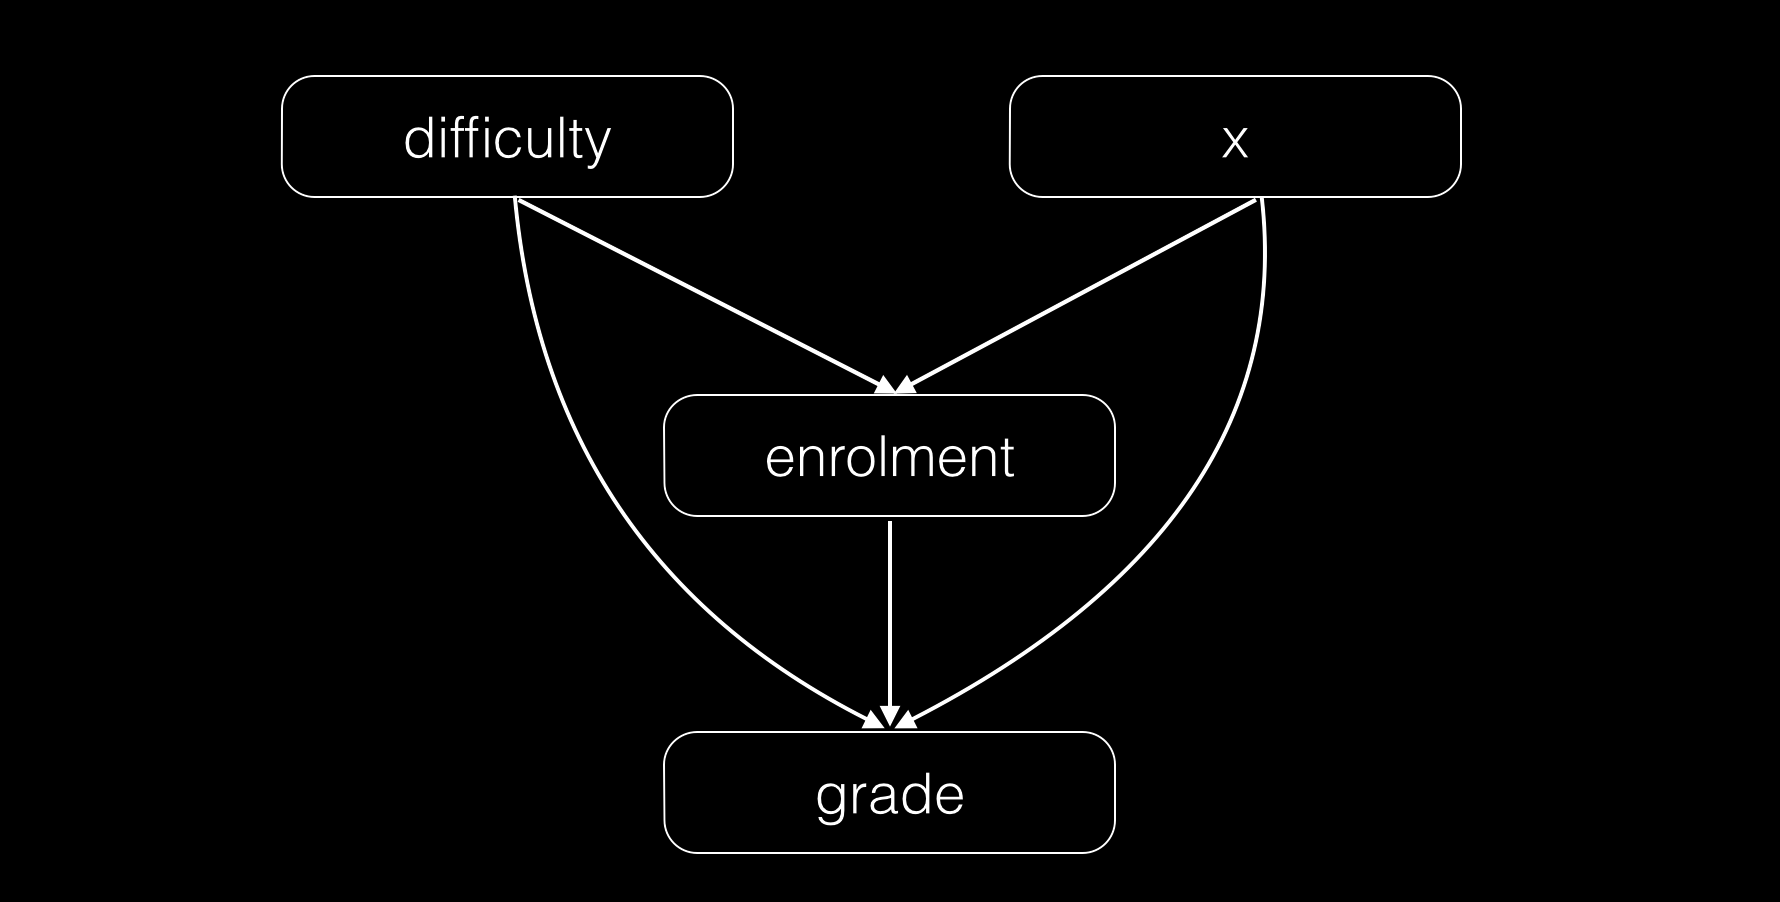 We will use bayesian methods to infer from the values of the observed variables the posterior distributions of the unobserved. We will then use those to construct our ranking. For exmaple we can rank students according to the expected value of $x$. To fully specify the network we still need to give priors for $x$ and $d$ as well as conditional distributions of $e$ and $g$ given the other two variables. We can without loss of generality assume normal priors for both $x$ and course $d$. The functional form of the conditional distributions of $e$ and $g$ still carry all the flexibility of the model. Their choice will make or break the model but it’s hard to make it without looking at the data. Nevertheless a sensible starting point could look like this:
$$ \begin{align} &P(e) = \sigma(x - d) \ &P(\neg e) = 1-P(e) \ &P(g) = c \exp((x - d - g)^2) \ \end{align} $$
Where $e \in { True, False }$ and $g \in { 1,2,3,4,5,6 }$ and the constant $c$ is chosen so that $P(g)$ is normalised.
This solution automatically accounts for users taking different sets of courses, courses differing in difficulty and the element of randomness associated with grading. It is also easily extensible. If for example we learn that a student wanted to enroll in some course $C$ but couldn’t for some external reason - we can easily incorporate this in the model. Or if there is some external variable weighing on the results that we want to account for - from student’s housing conditions to age of the student - it is straightforward to do so by creating additional node.
How would the algorithm behave if there were two non-overlapping curricula at the school? How would it learn the relative difficulty of two courses if there are no students connecting them? This is what priors are for. If students in the arts programme get systematically higher grades than students in the sciences programme, the algorithm would do the right thing - infer that sciences are harder and discount the grades accordingly. This assumes that students in both group are sampled from the same distribution - but there is absolutely no way to compare grades in non-overlapping curricula otherwise.
Recognizing sports events
A sports insights company has access to a feed of news and blog articles, some of which may be about sports events that this company cares about. Your task is to match sporting events - let’s say from your company’s database - to these articles. You should make sure that an article that mentions some event is really about it as opposed to just mentioning it in passing. This is necessary because we will then run sentiment analysis on these articles.
The problem can be broken down into two:
- For every article find candidate entities that the article may be about
- For every candidate decide whether the article is relevant enough
Part 1 will necessarily rely on name-matching. For every on of our relevant entities we need to know how it’s typically referred to in writing and look for that in the text of the article. For sports matches there are just a handful of patterns to look out for (e.g. “x vs y”) and crowdsourcing can help with harder irregular cases (CrowdFlower). The second part is more interesting. We can train a classifier to label entity-article pairs as either strong or weak matches. The classifier would use features like the number of entity occurences, type of sport, article source, number of other recognized entities in the text. We can also use something like TextRank which is an algorithm that judges how central a phrase is to the text as a whole.
Classifying companies
There are 4 millions active companies in the UK. We want to create a taxonomy of industry categories (e.g. “IT consulting” or “coal mining” may be sensible categories) and assign every company to one or more of these categories. The datasets we have include:
- official records containing basic financial information, number of employees, etc. for every company
- SIC code for most companies - these already form a taxonomy, unfortunately this taxonomy is outdated, too fine-grained (retail of crustaceans has its own code), not always accurate and a large fraction of companies fall into the code “other business activity”
- scraped websites of most companies
- wikipedia articles matched to companies (for 30k of the big companies)
- and other sources with texts or just keywords for companies
- a bipartite graph of companies and people where a company and a person are connected by an edge iff this person has at some point served as a director of the company This is a big and open ended problem. Describe in general terms your approach.
The solution will necessarily consist of 3 steps:
- Create a taxonomy
- Prepare a training set of companies labeled according to that taxonomy
- Train a classifier on the training set an apply it to the remaining companies
Step 3 is pure supervised machine learning. Step 2 will have to be manual, though mechanical turk can help. Step 1 will ultimately be a human decision dictated by business requirements but it can be informed by data. If we do some kind of clustering on the set of all companies and it results in a reasonable number of clearly delineated clusters then it would be a shame not to try to carve up the company-space at the joints. We should strive for a taxonomy of industries each of which comprises one or more clusters but never cuts a cluster in half. Obviously we would have to look at indivudual companies and come up with a description of each industry better than just pointing to the cluster of points. Even if this program doesn’t succeed entirely, it may reveal at least some industry clusters that we would have otherwise missed or show that two industries that we thought of as distinct form in fact a single tight cluster in the company space and therefore should be collapsed into one. How do we actually implement this clustering? Generic clustering algorithms like k-means won’t work with the kinds of data we have, at least not in its raw form. I see two other ways more suited for this problem:
- we can gather all the texts we have about every company and run topic modeling on those. topics -> clusters
- we can apply community detection to the company-director graph. Community detection algorithms find subsets of a graph that are highly connected strongly but weakly connected to the rest of the graph - these would be our clusters The final step is a straihtforward classification problem. The most important features will likely be all the texts we have about a company. Therefore we should use a classifier that plays nicely with text - naive bayes using n-grams is just that. We can also strenghten the classifier by considering companies that are closest to a given company in the company-director graph. If the classifier is not sure of a company’s industry but the company has 5 directors each of whom has also been a director of some advertising agency in the past then chances are that this company is also an ad agency or similar as opposed to for example a coal mine.
graphapalooza
This question is related to fraud detection but the real world details were left deliberately vague. There is an undirected graph G. Some vertices of G - we’ll refer to them as the “ground truth set” - have been manually assigned a number - fraudulence rating. We want to assign fraudulence rating to every vertex (including the ones in the ground truth set) according to two principles:
- We want the vertices in the ground truth set to get numbers close to the ground truth numbers (but not necessarily identical)
- We want neighbouring vertices to get similar values
Your task is to devise an algorithm that calculates the ratings while balancing between these competing objectives. In this interview I was asked to write down the formulas down to the last symbol, no handwaving.
This problem begs for, nay, demands a cost function. We will create a cost fuction over fraudulence ratings that penalizes a rating from straying too much from the ground truth and for varying too much between neighbouring vertices. Let’s denote by:
| Symbol | Meaning |
|---|---|
| $F$ | the set of all vertices |
| $G$ | the ground truth set |
| $g(i)$ | ground truth fraudulence value for vertex $i$ |
| $f(i)$ | our fraudulence value for vertex $i$ (the thing that we’re supposed to find) |
| $N(i)$ | the set of all neighbours of vertex $i$ |
The simplest cost function that satisfies the requirements is just the sum of squares of the things we want to minimize:
$$ I(f) = \alpha \sum_{i \in G}(f(i) - g(i))^2 + \beta \sum_{i \in F} \sum_{j \in N(i)}(f(i) - f(j))^2 $$
where parameters $\alpha$ and $\beta$ govern the tradeoff between the smoothness and faithfulness objectives. Quadratic cost functions are easy to optimise with gradient descent, and even analytically if the dimensionality isn’t too high. The interviewer insisted on being explicit with all the math, so here’s the formula for gradient descent update:
$$ \frac{\partial I(f)}{\partial f(i)} = (2 \delta_i \alpha + 4 \beta \left\vert{N(i)}\right\vert) f(i) - 4 \beta \sum_{j \in N(i)} f(j) - 2 \alpha \delta_i g(i) $$
where $\delta_i$ is the indicator function of $G$.
After writing this down I had a chat with the interviewer about gradient descent and its problems and how other convex optimisation algorithms address those problems. After that I got a followup: can this cost function be optimised without gradient descent, one vertex at a time? Yes it can, the process would still be iterative, but without any gradients. Can this second solution be parallelized so that multiple vertices are processed at the same time? What kind of graph (describe with words) would allow high parallelism? I’ll leave these last questions to the reader :). This interview was atypically heavy on ML details (same company that asked me to implement a classifier), you won’t see this kind of thing very often.
Impact of a promotion
We know how many units of a product sold at some supermarket in every week over several years (here my interviewer scribbles a time series plot). Some of the weeks in question the product has been on promotion, and you can see spikes in sales for those weeks. We have information about every promotion - when was it, type of promotion, how big a discount etc. How do you use this information to predict the impact of a future promotion on the same product? How many extra units of the product will be sold if it’s on promotion again?
Let’s try to solve a simplified version of the problem first. If we could always tell how many units would be sold in the absence of any promotion (both in the past and the future), then this would become a straightforward supervised regression problem. Just gather all the instances of promotions in the past - this will be the training set. Use all the parameters of the promotion as features and train a regressor to predict the uplift (units sold in the promotion minus units that would be sold anyway). Then apply this trained regressor to the future planned promotion. So far so good. The problem is - we don’t really know the “how many units would have been sold anyway” part. Not for the past promotions and not for the future. So the second part of the problem is to estimate this very quantity. This problem is again a classic. Given a time series (of sales numbers) fill the gaps in it and extrapolate into the future. The most basic and time tested way to do it is to model the time series $Y$ as a product of three factors:
$$ Y = T \cdot S \cdot I $$
where $T$ denotes trend, $S$ seasonal factor (a function with a period of 1 year) and $I$ - irregular factor (random noise). We can find $T$ by simply fitting a straight line to the data. Then we can use it to find $S$.
$$ \frac{Y}{T} = S \cdot I $$
Since the irregular factor $I$ by definition oscillates around $1$, any consistent deviation of $S * I$ from $1$ is due to $S$. We can estimate $S$ by averaging the values of $S *I$ for that particular time of year across all the available years. Having calculated $T$ and $S$ we can extrapolate the time series to any time in the past of future.
In my interview I talked about this approach because I happened to have used it previously but I think just recognising the problem as time series modeling might have been good enough. Bonus points for name dropping ARIMA.
Identifying scraped content
Description: We encounter different document types during our crawl. Some of these categories are as follows:
- Source code - source code from sites like github, stackoverflow or other websites
- Configuration files - different formats like xml, json, property and .ini files etc
- Log files - ranging from Linux system logs, game logs, apache web server logs, exception logs etc
- SQL table dumps - containing database dumps of records
- SQL queries - containing MySQL queries used to export data from databases
- Ascii art - Does not exist in isolation, but many leaked documents contain ascii art especially in the beginning of the document which hackers use as a signature
- Emails - from different user group forums on programming languages etc
- Textual output of xls sheets containing numbers (could also include financial information)
Documents could contain a mixture of these categories. For the purpose of this discussion, you can assume that labelled data is available for all these categories. But keep in mind that the number of categories could increase in the future and that you may not have enough training data. For example you could have a new category “bank account numbers”. We do not have an exhaustive list of bank account numbers as they change from bank to bank and country to country. Please outline a methodology for solving this problem and we can discuss it during the interview.
Would be great if you can outline an approach which can be implemented and deployed quickly so that we get early feedback on production data, understand the bias and also present a theoretically sound long term solution. Please mention the areas that you would research to achieve the same.
Note that this was an over-the-weekend homework assignment, not something dumped on me during during the interview.
This is essentially a classic text classification problem slightly complicated byt the fact that there multiple classes may be present in a single document. We can get around that by splitting the document into chunks and classifying each one.
As always there is a tradeoff to be made here between the power of solution, its complexity and it’s labour intensity.
The least conceptually complicated solution will require the most tuning and handcrafted features, probably the most code. But it is also straightforward to implement. Simply use a Naive Bayes classifier (or perhaps an SVM or something else, but NB should suffice) + features handcrafted for each type of document. Naive Bayes text classification typically uses Bag of Words features. This could work for classifying some programming languages (but not all) and would fail completely for things like ASCII art. But in addition to BoW we can add
- Bag of Characters - ASCII art for example has distinctive distribution of characters
- Bag of Anonymised Words - like BoW but replace every lowercase character with “a” and every uppercase with “A” and every digit with “0”. This way you get way less distinct words but you can still tell that something is camelcase or has underscores in it or ends with a colon etc. and thus distinguish between programming languages
- grep for timestamps and use the fraction of all lines in the text that contain a timestamp as a feature. This would be a strong feature for recognising log files
- fraction of lines that share a common prefix (modulo anonymisation) - also good for log files
For any new kind of file think about how you - the human being - are able to tell this type of file apart and whatever characteristic you come up with - turn it into a binary feature (characteristic present - not present) or real-valued feature (count of times characteristic present per line of text). Do this enough times and you should achieve any desired accuracy. This solution may be quite labour-intensive but IMO not excessively so. A big plus of the solution is that we can make up for the scarcity of training examples of some class by handcrafting feature appropriate for that class.
The more principled (but harder to pull off and less certain) approach would be to use a character level RNN. Preferably a bidirectional one. Train it to predict a label for the entire document or a label for every character thus allowing multiple classes per document. char-RNN should be able to pick up on any regularities that in the previous approach would have to be hardcoded. char-RNN can be pretrained on unlabeled data thus decreasing the neccessary amount of labeled data.
Neither of these solutions quite solves the problem of not enough data but maybe they don’t have to. Perhaps instead of inventing new algorithms that can learn to classify a new type of document after just a few examples it would be easier to just get more examples. You can generate new examples by modifying existing ones (like replacing words with synomyms in emails or digits in a bank account number with other digits). Or you can ask the workers at Mechanical Turk to provide examples.
Finally, the most promising and most risky approach would be to use this neural network architecture which is supposed to be able to learn to classify a new class after seeing just a few examples.