I have blogged about the wide usefulness of topic models and I have benchmarked word-embedding-assisted classification on Reuter’s benchmark. This time I experiment with these ideas using a real world and decent sized dataset - the graph of UK/Irish companies. I have done this during my “10% time” at DueDil (it’s like google’s “20% time”, except it exists).
Graph of companies
There are 4 million active companies in the UK and Ireland. DueDil collects all kinds of information about them - financials, legal structures, contact info, company websites, blogs, news appearences etc. All of it is presented to our users and some of it also serves as input to machine learning tasks - like classifying companies into industries.
One very interesting dataset that remains underutilised (AFAIK by anyone, not just DueDil) is the network of connections of companies and directors.
You can tell a lot about a company just by looking at its directors. That is - if you know anything about these people. At DueDil we don’t know much more than just their identities. This would be rather useless in the context of a single company. But there are millions of companies and people who serve as their directors more often then not do it many times in their careers at different companies. Knowing that the director’s name is Jane Brown may be useless, but knowing that the director previously held similar positions at three different tech startups is highly relevant. And this is just one director out of many and one type of relationship.
More generally, one can think about companies as nodes in a graph. Two companies are connected iff there is a person who has served as a director at both of them (not necessarily at the same time). I will call this the company graph. Here’s a part of the graph containing DueDil.
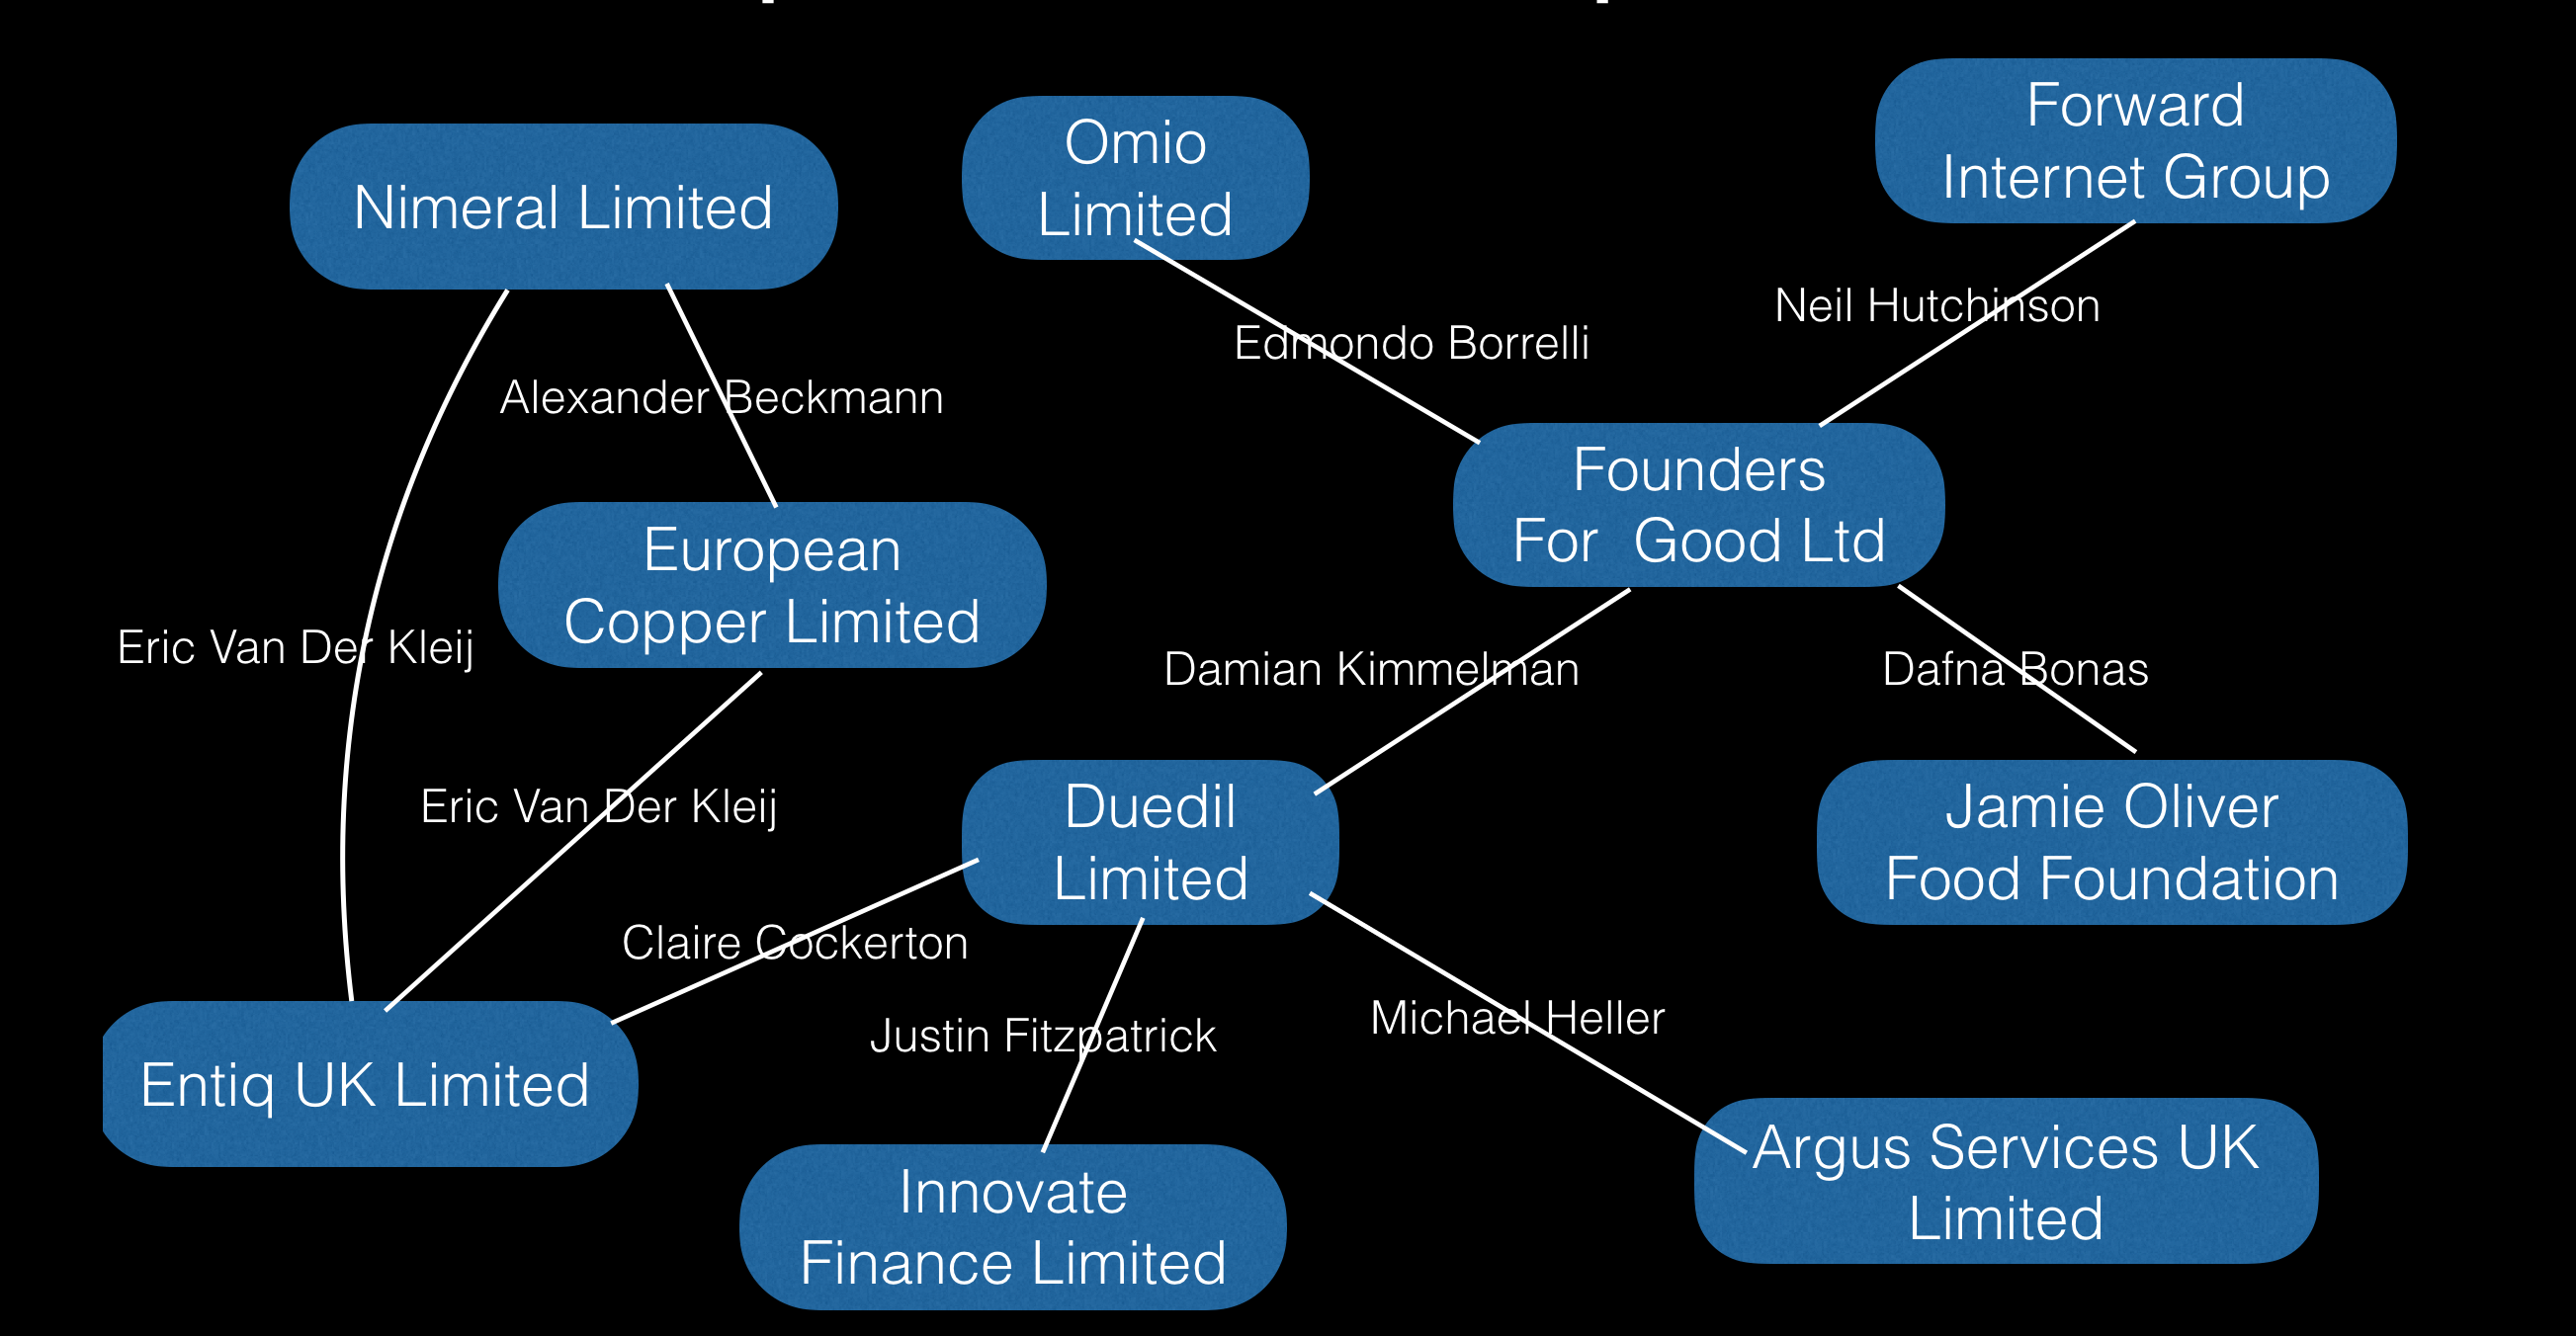
DueDil is connected to Founders For Good Ltd because our CEO Damian Kimmelman is also a director at the other company.
It is intuitive that the position of a company in this graph tells us something about the company. It is however difficult to do anything with this information unless it is somehow encoded into numbers.
Company2Vec
This is where word embeddings come in. As I mentioned previously, it is possible to apply Word2Vec to a graph to get an embedding of graph nodes as real-valued vectors in a procedure called DeepWalk. The idea is very simple:
- Construct a bunch of random walks on the graph
- Feed the random walks into Word2Vec
A random walk is just a sequence of nodes, where the next node is always one of the neighbours of the previous node, chosen at random. Think: Duedil -> Founders For Good Ltd -> Omio Limited.
Word2Vec accepts a collection of documents - where every document is a list of tokens (strings). Here company Id’s play the role of tokens and random walks play the role of documents. It all checks out.
To limit the size of the graph for this proof of concept, I have applied this procedure only to the 2.2 million companies that
- are active
- have at least one edge (director in common) to another active company
I generated 10 random walks starting at every company, the length of each walk was 40. Training Word2Vec with gensim on this corpus of $10 \times 40 \times 2200000 = 8.8 \times 10^8$ tokens took over 11h. It also took a machine with 40gb of RAM before it stopped crashing even though the random walks were generated on-line.
Finally I got some vectors out of it - one per company. These vectors themselves were the goal of this project (they can serve as features in ML), but I also made some plots to verify that the algorithm is working as advertised.
Pretty pictures with t-SNE and Bokeh
The embedding produced by DeepWalk was 100-dimensional in this case, so I had to do some dimensionality reduction before trying to visualize the vectors. t-SNE is perfect for this kind of thing. Here’s a sample of 40000 company vectors embedded in 2D with t-SNE. You can move or zoom in the plot or hover over the dots to see the names of the corresponding companies.
It worked! You can immediately see that there is some structure in the data and t-SNE has picked up on it (and this is only a tiny sample - 2% of all the datapoints). What does this structure mean? After the graph has beed transformed with DeepWalk and then t-SNE, the position of a company in this plot doesn’t have a simple interpretation but it’s clear that groups of highly interconnected companies will correspond to clusters of points in this plot. And it’s easy to verify just by looking at the names of the companies that this is the case.
Take the big blob in the upper left corner - the companies there:
- Edwards Macliammoir Dublin Gate Theatre Productions Limited
- Humanist Association of Ireland Limited
- Kildare Street Management Limited
- Shannon Airport Authority Limited
We have discovered the cluster of irish companies! And if you zoom in on the long, narrow appendage sticking out of this cluster towards bottom left - you’ll see companies like:
- Tempelhof Aircraft Leasing (Ireland) Limited
- Gallic Dragon Aviation Limited
- Aergen Aircraft Ten Limited
… and hundreds more. This is not even cherry-picked. I hereby declare the discoverery of the Irish Aviation Peninsula.
Slightly up and to the right of center there is a smaller scottish cluster recognizable through such companies as
- Caledonian Sausage Company
- Edinburgh Tattoo Productions Limited
- Dundee Ice Arena
There are many other smaller clusters and it’s actually a fun exercise to try to pinpoint exactly what do the companies in a cluster have in common.
Now in color!
This was fun if somewhat grim looking. Let’s try to add some color to the plot. The original goal of this project was to get graph-derived features for industry classification. Let’s try using different colors to denote different industries (based on SIC codes). If DeepWalk coordinates are predictive of the industry a company is in, we should expect to see same-colored dots (companies in the same industry) clustering together in the plot. Does this actually happen?
A little bit, yes.
Mostly everything is a big reddish mess (“services” is the most popular category). But there are indeed some clusters. Right of center we can see a medium sized pink blob of insurance companies:
- US Risk (UK) Newco Limited
- Zenith Insurance Management UK Limited
- North Star Underwriting Limited
Below it and to the left lies another, this one green:
- Timeless Films Limited
- Hercules Productions Ltd
- Koninck studios PTE Limited
Clearly this is a cluster of film companies (plus other media). If you look more closely you will discover that this is actually the cluster of London based film companies. Nearby there is a smaller green cluster of media companies from the rest of England and another one for Wales. These are less clearly delimited and partly obscured by the red dots of “Services” companies. There are many others, but they are sometimes so tight, they appear as a single dot in the plot.
This is more noisy than I hoped for but it’s definitely working. Would definitely improve accuracy of industry classification if used with other stronger features. Plus you can learn interesting things from it just by looking at the plot. Like the fact that film production companies are closely connected to each other and relatively unconnected to the rest of the world. Or that London is a different country as far as media companies are concerned.
Bonus: keyword based company embedding
Having all this t-SNE and Bokeh niceness in place I couldn’t resist applying it to another interesting dataset - keywords. Keywords are a set of industry related tags that DueDil has for millions of companies. They are things like “fishing” or “management consulting” or “b2b”. A company usually has between a few and a few dozen of them.
A byproduct of the pipeline that extracts keywords for companies is a Word2Vec embedding of the keywords. I used this embedding to create an embedding of companies. This was done simply by averaging all the vectors corresponding to a company’s keywords. I ran the resulting vectors through t-SNE and here’s what it looks like:
I shouldn’t be surprised that keywords - which were picked to be industry related - predict the industry really well. But I was blown away by the level of detail preserved by t-SNE. There are recognizable islands for everything. There is a golden Farmers Archipelago and a narrow blue Dentist Island south from Home Care Island. There is a separate Asian Island in the Restaurant Archipelago - go see for yourself.
This was fun. Long live Word2Vec and t-SNE!