How do you train a binary classifier when you have only positive-labeled training examples? Impossible? Maybe. But sometimes you can do something just as good. Let’s start from the beginning…
Lead generation
Everyone and their mum in the b2b sector is trying to use machine learning for lead generation. For our purposes lead-gen means selecting from the millions of active companies in your country the ones that are most likely to buy your product once contacted by your sales team. Needless to say lead generation is extremely serious business and constitutes a market sector in its own right - a type of b2b2b if you will.
One popular lead-gen strategy is to look for leads among companies similar the ones that have worked out for you in the past. A machine learning implementation of this strategy is straightforward:
- collect data on all relevant companies
- take all the companies your sales have contacted in the past and label every one as either successful (you made money) or failed (you wasted your time) lead. This is your training set.
- extract good features for every company*
- train a binary classifier (predicting successful/failed label) on your training set. Ideally this should be a classifier that outputs probabilities.
- apply the classifier to all the companies outside the training set and hand the results over to sales. The number assigned by the classifier to a given company is (in theory at least) the probability that the lead will be successful. Highest scorers should be prioritized, low scorers should be left alone. So far, so good.
Forgetting salesman problem
An interesting difficulty frequently arises when you try to apply this approach in real life. Sales teams usually have good records on their clients but often fail to keep track of all the prospects that didn’t work out. As a result, you end up with only positive examples to train your classifier on. It’s not possible in general to train a classifier on a training set with one class amputated this way. But…
The solution
TL;DR = divide density of “good points” by density of all - this is the lead score
Keep in mind that:
- in addition to the positive examples, you have also the full set of all data points (all companies whether previously contacted or not)
- you are not interested in the absolute probability of success of a given lead per se. You only really need the relative ranking of different leads. All the classifier scores may be off by a factor of 10 but as long as the order is preserved - you’ll still be able to prioritize good leads over rubbish ones.
A solution will present itself once the problem is stated in mathematical terms. Consider the space of all possible company features $X$. Given are:
- a set $C$ of points in $X$ - all companies
-
a subset $T_+$ of the above set - companies that were tested and gave positive result Unknown are:
- the probability $f(x)$ that a company $x$ will test positive
- the subset $T$ of all tested companies
This is how it looks in an artificial 1-D dataset.
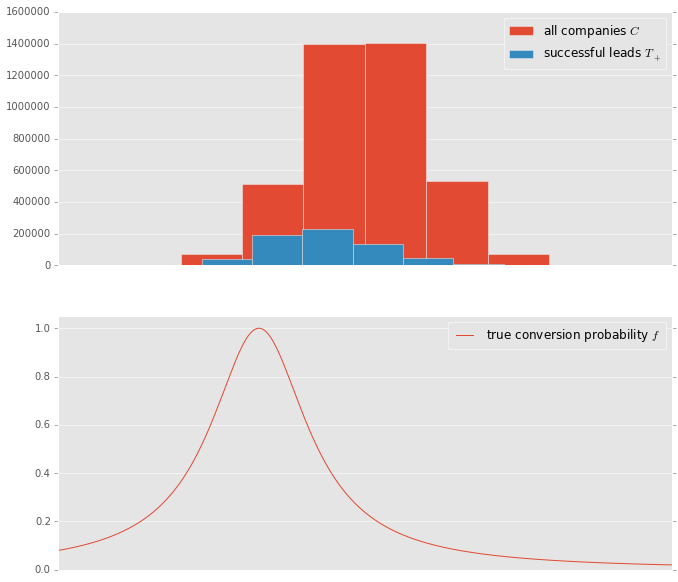
Notice that the distribution of companies $C$ and the conversion probability $f$ peak at different points and the distribution of positive exmaples $T_+$ peaks somewhere between those two.
It’s useful to think of $C$ as a sample from some probabilty distribution $P(x)$ defined on $X$. Or to express the same in the language of point densities in space:
If the companies tested $T$ were chosen at random from all companies $C$ then they constitute a sample from the same probability distribution $P(x)$
Since a company’s chance of testing positive is $f$, the density of companies that tested positive is simply:
The set $T$ is hidden from us but $C$ and $T_+$ are available so we can use them to find $f(x)$. Combining the first and third equation we get:
This is it. If we can just estimate the densities of $C$ and $T_+$ - we’re golden. Their ratio gives the $f$ function up to a constant, which is all we need to do lead scoring. There are many ways to do density estimation in practice:
- histogram based estimation - lowest on the sophistication scale - divide the space $X$ into sectors and count the number of points in every sector, divide it by volume. Do it for both $C$ and $T_+$ and divide one result by the other
- nearest neighbour estimation - for any interesting point find $k$ (let’s say $k=20$) nearest points in $C$. Count how many of them are also in $T_+$, divide the figures
- kernel based estimation - in a way this is similar to the knn version - except instead of taking k nearest points you take all of them but discount the farthest by a dicreasing function of distance
This is how it looks on our toy dataset:
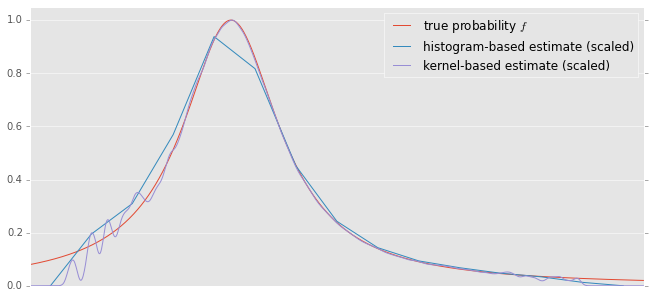
Unsuprisingly, on a toy model everything works rather well. In reality conversion rates are low, data is sparse, dimensionality is high and even the basic assumption “good lead means similar to what has worked in the past” is questionable. But you have to start somewhere.
For more information about the ML aspect of classification without negatives google the term “PU learning”.
* this is arguably the hardest and most important step, but I’m glossing over it as it’s not relevant to this post
** if there is prior knowledge regarding how the contacted companies were chosen, it can be easily incorporated