TL;DR: I prepared 5 puzzles about statistics that should be accessible to anyone without being trivial. Scroll down for the puzzles.
Data Science and Statistics
“Data science is statistics on a Mac”
Then there is the famous Venn diagram with data science on the intersection of statstics, hacking and substantive expertise.
What the hell?
Based on all those memes one would think that data scientists spend equal amounts of time writing code and writing integrals on whiteboards. Thinking about the right data structure and thinking about the right statistical test. Debugging pipelines and debugging equations.
And yet, I can’t remember a single time when I got to solve an integral on the job (and believe me, it’s not for lack of trying). I spent a total of maybe a week in the last 3 years explicitly thinking about statistical tests. Sure, means and medians and variances come up on a daily basis but it would be setting the bar extremely low to call that ‘doing statistics’.
Someone is bound to comment that I’m doing data science wrong or that I’m not a true data scientist. Maybe. But if true data scientist is someone who does statistics more than 10% of the time, then I’m yet to meet one.
The other kind of statistics
But maybe this is the wrong way to think about it. Maybe my problem is that I was expecting mathematical statistics where I should have been expecting real world statistics.
Mathematical statistics is a branch of mathematics. Data scientists like to pretend they do it, but they don’t.
Real world statistics is an applied science. It’s what people actually do to make sense of datasets. It requires a good intuitive understanding of the basics of mathematical statistics, a lot of common sense and only infrequently any advanced knowledge of mathematical statistics. Data scientists genuinely do it, a lot of the time.
In my defense, it was an easy mistake to make. Mathematical statistics is what is taught in most courses and textbooks. If any statistics questions come up in a job interview for a data science role - it will be the mathematical variety.
To illustrate what I mean by ‘real world statistics’, to show that this discipline is not trivial and is interesting in its own right, I prepared a short quiz. There are 5 questions. None of them require any complicated math or any calculations. They do require a good mathematical intuition though.
I encourage you to try to solve all of them yourself before checking the answers. It’s easy to convince yourself that a problem is trivial after you’ve read the solution! If you get stuck though, every question has a hint below.
Questions
Cancer
According to CDC data, US counties with the lowest incidence of kidney cancer happen to all be rural, sparsely populated and located in traditionally Republican states. Can you explain this fact? What does it tell us about the causes of cancer?
Bar Fights
According to a series of interviews conducted with people who have been in a bar fight, 9 out of 10 times, when someone dies in a bar fight, he was the one who started it. How can you explain this remarkable finding?
Competitions
After Google measured on-the-job performance of their programmers, they found a negative correlation between being a former winner of a programming competition and being successful on the job. That’s right - champion coders did worse on average. That raises important questions for recruiters. Do programming competitions make you worse at 9-5 programming? Should employers start screening out champion coders?
Exams
It is well documented that students from underprivileged backgrounds underperform academically at all levels of education. Two students enter a university - one of them comes from an underprivileged group, the other from a privileged one. They both scored exactly the same on the university admission exam. Should you expect the underprivileged student to do better, the same or worse in the next university exam compared to the other student? Bear in mind that while their numerical scores from the admissions test were the same, it means that the underprivileged student heavily outperformed expectations based on his/her background while the other student did as well as expected from his/her background.
Sex partners
According to studies the average number of sex partners Britons have had in their lives is 9.3 for men and 4.7 for women. How can those numbers possibly be different? After all, each time a man and a woman become sex partners, they increase the total sex partners tally for both sexes by +1. Find at least 5 different factors that could (at least in theory) account for the difference and rate them for plausibility.
Hints
Cancer
Bar Fights
Competitions
Exams
Sex Partners
Answers
Cancer
It tells us nothing about causes of cancer, it’s a purely statistical effect and it has to be this way. Sparsely populated counties have less people in them, so sampling error is higher. That’s it. Think about an extreme case - a county with a population of 1. If the only inhabitant of this county gets kidney cancer, the county will have 100% kidney cancer rate! If this person remains healthy instead, the county will have cancer incidence rate of 0%. It’s easier for a small group of people to have extremely high or extremely low rate of anything just by chance. Needless to say, republicanism has nothing to do with cancer (as far as we know) - it’s just that rural areas are both sparsely populated and tend to lean Republican.
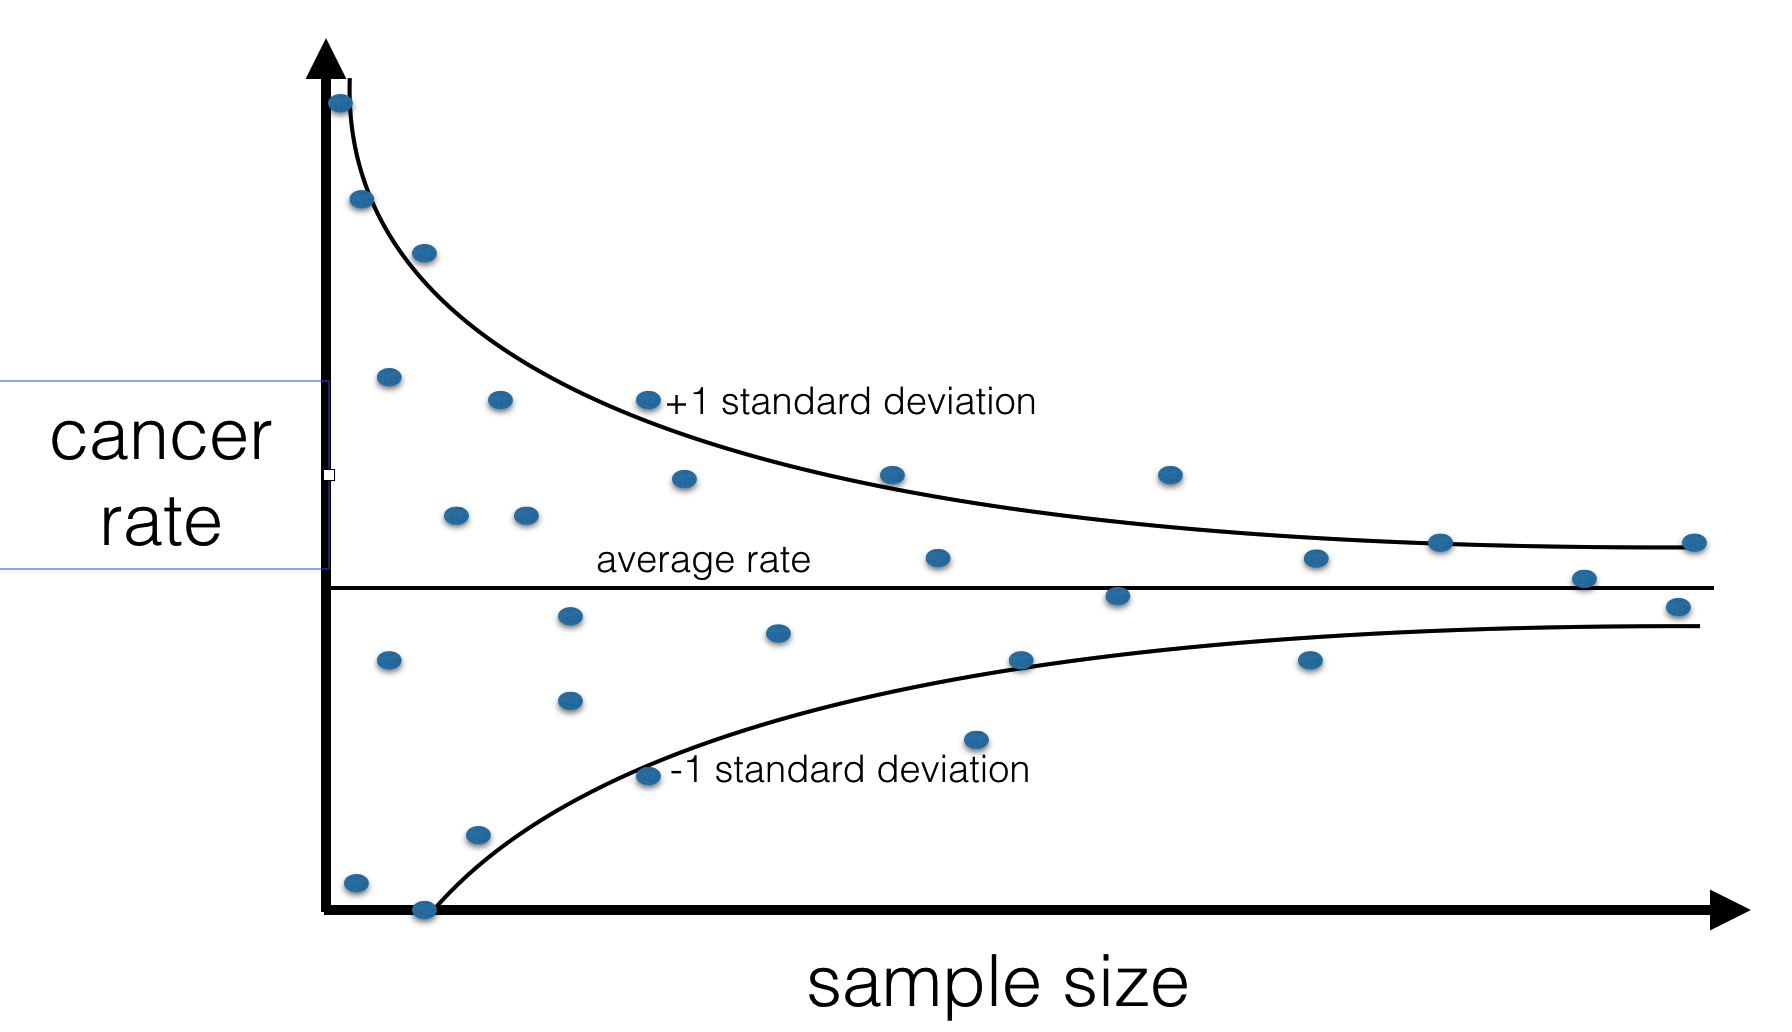
This example comes from Daniel Kahneman’s awesome book Thinking Fast And Slow. This blog post has a really nice visualisation of the actual CDC data that illustrates this effect.
Bar Fights
People lie. Of course the dead one will be blamed for everything!
Competitions
This one is slightly more subtle. It is not inconceivable that being a Programming Competition Winner (PCW) makes one less likely to be a Good Engineer (GE). But this is not the only and IMO not the most plausible explanation of the data. It could very well be that in the general population there is no correlation between GE and PCW or a positive correlation and the observed negative correlation is purely due to Google’s hiring practices. Imagine a fictional hiring policy where Google only hires people who either won a competition (PCW) or are proven superstar engineers (GE) - based on their open source record. In that scenario any engineer working at Google who was not a PCW would automatically be GE - hence a negative correlation between GE and PCW among googlers. The correlation in the subpopulation of googlers may very well be the opposite of the correlation in the entire population. Treating PCW as a negative in hiring programmers would be premature.
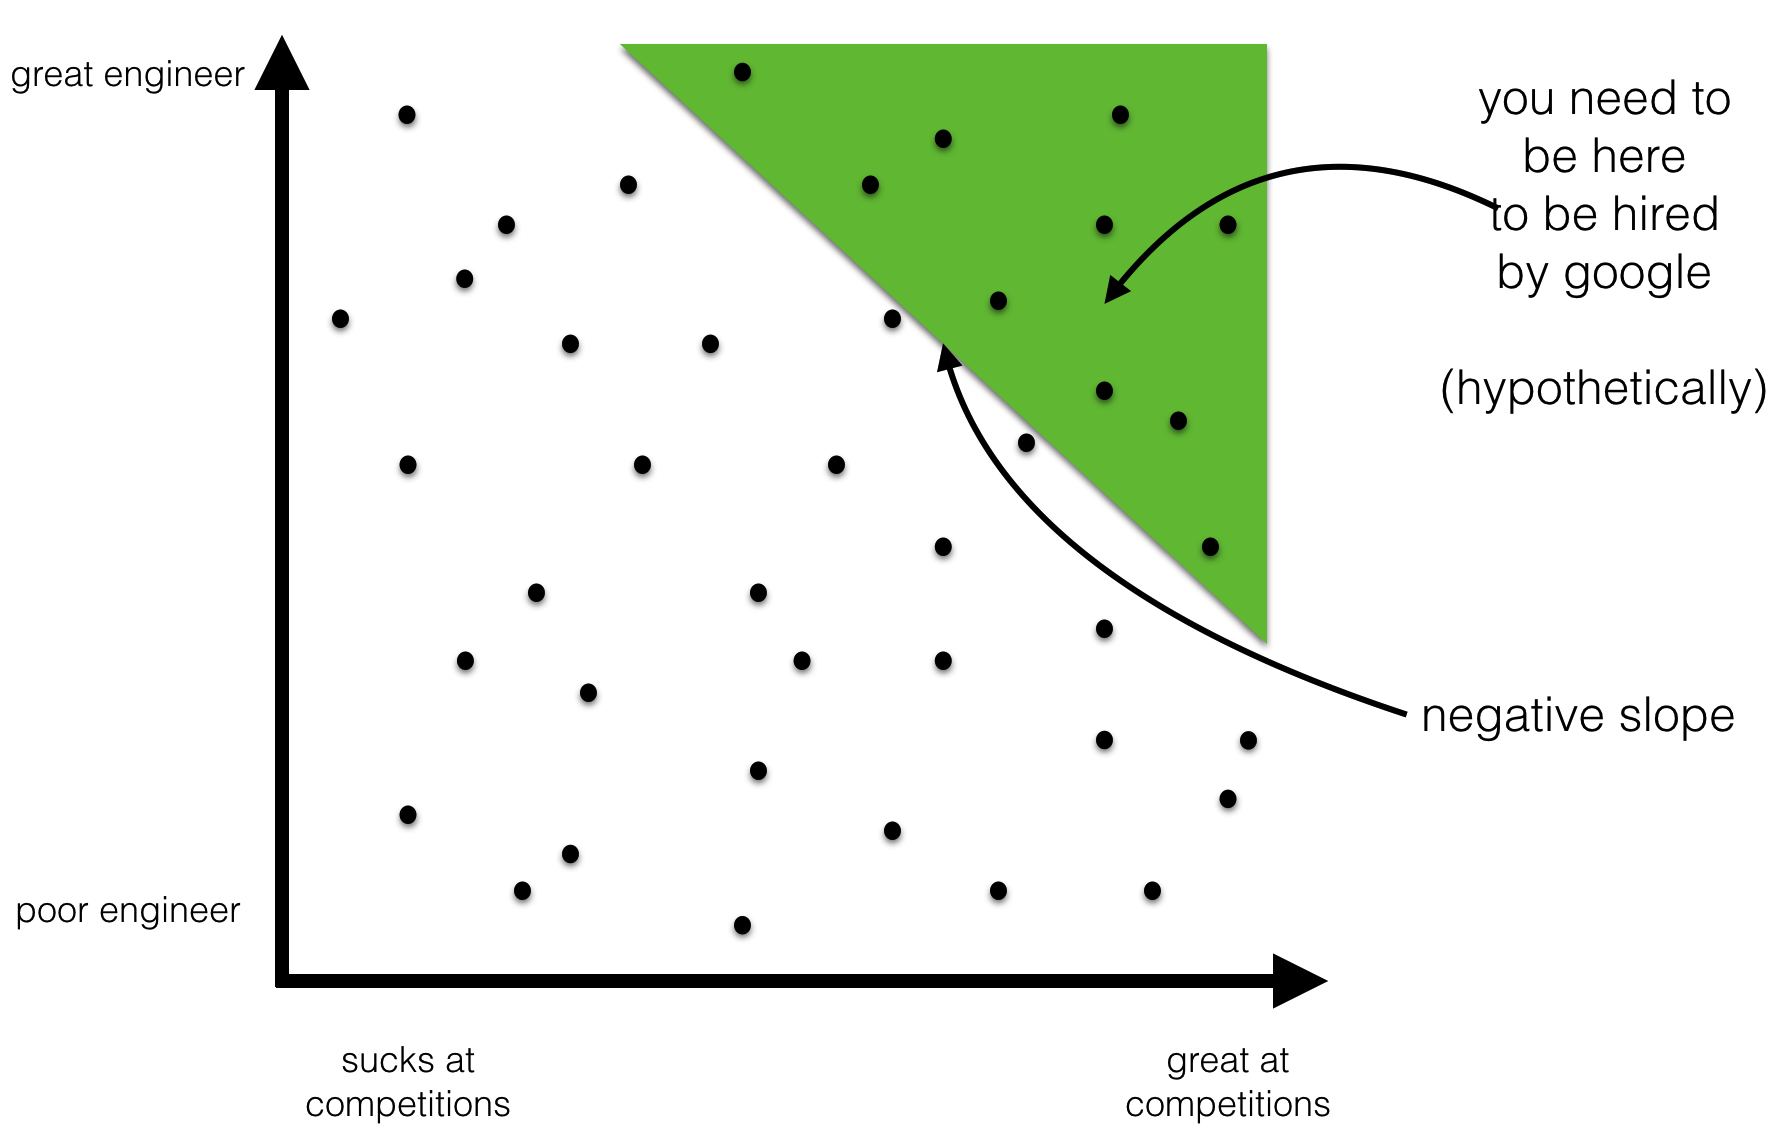
Erik Bernhardsson has a post with nice visual illustration of this phenomenon (which is an of Berkson’s Paradox). The same principle also explains why all handsome men you date turn out to be such jerks.
Exams
The underprivileged student should be expected to do worse. The reason is simple - the admissions test is a measure of ability but it’s not a perfect measure. Sometimes students score lower or higher than their average just by chance. When a student scores higher/lower than expected (based on demographics and whatever other information you have) it is likely that the student was lucky/unlucky in this particular test. The best estimate of the student’s ability lies somewhere between the actual test score and our prior estimate (which here is based on the demographics).
To convince yourself that it must be so, consider an example from sports. If a third league football team like Luton Town plays a top club like Real Madrid and ties, you don’t conclude that Luton Town is as good as Real Madrid. You raise your opinion of Luton Town and lower your opinion of Real Madrid but not all the way to the same level. You still expect Real Madrid to win the rematch.
This effect is an example of regression to the mean and it is known as Kelley’s Paradox. This paper illustrates it with figures with actual data from SAT and MCAT exams. You will see that the effect is not subtle!
Sex Partners
Average number of sex partners for males is the sum of the numbers of sex partners for all the males divided by the number of all the males:
similarly for females:
The reason we think $MSP$ and $FSP$ should be equal is that every time a man and a woman become sex partners, the numerators of both $MSP$ and $FSP$ increase by $+1$. And the denominators are approximately equal too. Let’s list all the ways this tautology breaks down in real life:
- People lie.
- There are are more homosexual men than homosexual women and they tend to have more partners. A homosexual relationship between men contributes $+2$ to the numerator of $MSP$ but not to $FSP$.
- Non-representative sample. If for example prostitutes are never polled or refuse to answer the survey, that could seriously lower the estimate (but not the real value) of the female average.
- Men and women may be using different definitions of sexual intercourse. I leave it to the reader to imagine all the situations that the male but not the female participant would describe as having had sex - without either of them technically lying. In such a situation only the numerator of $MSP$ increases. This may or may not be an issue depending on the exact phrasing of the survey.
- There are actually more women then men, so the denominator of $FSP$ is higher. This effect is undoubtedly real but too tiny to explain anything.
And there are other factors as well, although it’s not clear to me which way would they tend to bias the ratio:
- Britons may be having sex partners outside UK. This may be either while they are travelling abroad or the sex partner may be a tourist visiting UK. Each such partner would only contribute to one of $MSP$, $FSP$ but not the other.
- Immigration and emigration both lead to a situation where some of the sex partners of people who currently live in the UK don’t themselves (currently) live in the UK. Depending on the sex partner statistics of the people immgrating to/emgigrading from the UK, this may contribute to the $MSP$, $WSP$ discrepancy.
- People are dropping out of the population by dying. This, combined with sex differences in the age people have sex, can result in a discrepancy between $MSP$ and $FSP$. Consider a country where every male finds 3 female sexual partners as soon as he turns 18 but those partners are exclusively women on their deathbeds. In such country almost every adult male would have had 3 sex partners and almost every female would have had 0 (except for a tiny fraction of females who are about to die).
Conclusions
- random sampling error produces non-random seeming results (Cancer)
- the measurement method affects the outcome (Bar Fights)
- nonrepresentative samples lead to spurious correlations (Competitions)
- measurements are never 100% reliable. An accurate estimate of a quantity must combine the measurement with prior distribution (Exams)
- seemingly well defined concepts at closer inspection turn out to be slippery (Sex Partners)